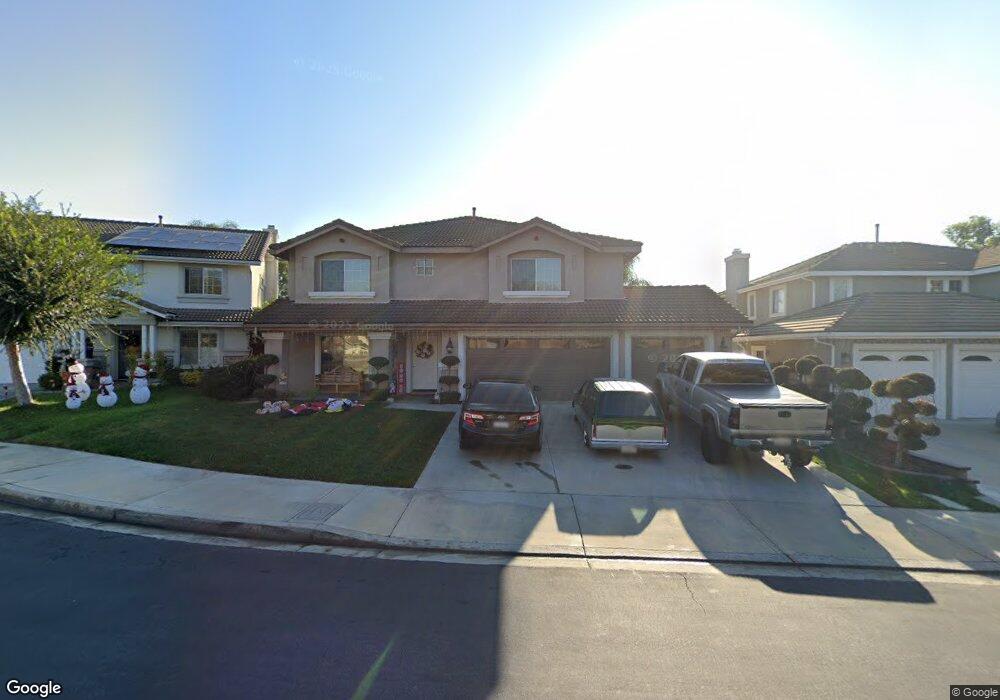
5581 Yew Ln Chino Hills, CA 91709
South Chino Hills NeighborhoodEstimated Value: $1,127,513 - $1,405,000
4
Beds
3
Baths
2,830
Sq Ft
$453/Sq Ft
Est. Value
About This Home
This home is located at 5581 Yew Ln, Chino Hills, CA 91709 and is currently estimated at $1,280,878, approximately $452 per square foot. 5581 Yew Ln is a home located in San Bernardino County with nearby schools including Michael G. Wickman Elementary School, Robert O. Townsend Junior High School, and Chino Hills High School.
Ownership History
Date
Name
Owned For
Owner Type
Purchase Details
Closed on
Aug 22, 2011
Sold by
Gonzalez Jorge
Bought by
Gonzalez Jorge and Gonzalez Angelica
Current Estimated Value
Home Financials for this Owner
Home Financials are based on the most recent Mortgage that was taken out on this home.
Original Mortgage
$393,000
Outstanding Balance
$263,063
Interest Rate
3.87%
Mortgage Type
New Conventional
Estimated Equity
$1,017,815
Purchase Details
Closed on
Mar 8, 2010
Sold by
Gonzalez Jorge
Bought by
Gonzalez Jorge and Gonzalez Angelica
Purchase Details
Closed on
Feb 26, 2003
Sold by
Fieldstone Pinehurst Llc
Bought by
Gonzalez Jorge and Gonzalez Angelica
Home Financials for this Owner
Home Financials are based on the most recent Mortgage that was taken out on this home.
Original Mortgage
$394,050
Interest Rate
5.79%
Create a Home Valuation Report for This Property
The Home Valuation Report is an in-depth analysis detailing your home's value as well as a comparison with similar homes in the area
Home Values in the Area
Average Home Value in this Area
Purchase History
| Date | Buyer | Sale Price | Title Company |
|---|---|---|---|
| Gonzalez Jorge | -- | Investors Title Company | |
| Gonzalez Jorge | -- | Investors Title Company | |
| Gonzalez Jorge | -- | None Available | |
| Gonzalez Jorge | $493,000 | First American |
Source: Public Records
Mortgage History
| Date | Status | Borrower | Loan Amount |
|---|---|---|---|
| Open | Gonzalez Jorge | $393,000 | |
| Closed | Gonzalez Jorge | $394,050 | |
| Closed | Gonzalez Jorge | $49,250 |
Source: Public Records
Tax History Compared to Growth
Tax History
| Year | Tax Paid | Tax Assessment Tax Assessment Total Assessment is a certain percentage of the fair market value that is determined by local assessors to be the total taxable value of land and additions on the property. | Land | Improvement |
|---|---|---|---|---|
| 2025 | $9,487 | $713,413 | $214,025 | $499,388 |
| 2024 | $9,487 | $699,424 | $209,828 | $489,596 |
| 2023 | $9,237 | $685,710 | $205,714 | $479,996 |
| 2022 | $9,157 | $672,264 | $201,680 | $470,584 |
| 2021 | $8,977 | $659,082 | $197,725 | $461,357 |
| 2020 | $8,848 | $652,324 | $195,698 | $456,626 |
| 2019 | $8,779 | $639,534 | $191,861 | $447,673 |
| 2018 | $8,616 | $626,994 | $188,099 | $438,895 |
| 2017 | $8,474 | $614,700 | $184,411 | $430,289 |
| 2016 | $8,003 | $602,647 | $180,795 | $421,852 |
| 2015 | $7,871 | $593,594 | $178,079 | $415,515 |
| 2014 | $7,787 | $581,967 | $174,591 | $407,376 |
Source: Public Records
Map
Nearby Homes
- 16629 Quail Country Ave
- 16631 Sagebrush St
- 16675 Bear Creek Ave
- 16731 Swift Fox Ave
- 5575 Veronese Dr
- 17004 Viana Dr
- 16848 Morning Glory Ct
- 17028 Barcelos Dr
- 17065 Branco Dr
- 5185 Highview St
- 16694 Tourmaline St
- 5176 Glenview St
- 16433 Garnet Way
- 5142 Cellini Dr
- 17204 Guarda Dr
- 17185 Guarda Dr
- 4936 Highview St
- 4949 Highview St
- 17168 Penacova St
- 5521 Stargaze St
- 5569 Yew Ln
- 5585 Yew Ln
- 16673 China Berry Ct
- 16685 Quail Country Ave
- 16660 China Berry Ct
- 16665 China Berry Ct
- 16708 Quail Country Ave
- 16657 China Berry Ct
- 16677 Quail Country Ave
- 16716 Quail Country Ave
- 16652 China Berry Ct
- 16700 Quail Country Ave
- 16649 China Berry Ct
- 16669 Quail Country Ave
- 16644 China Berry Ct
- 16692 Quail Country Ave
- 16790 Sagebrush St
- 16641 China Berry Ct
- 16743 Sagebrush St
- 16684 Quail Country Ave