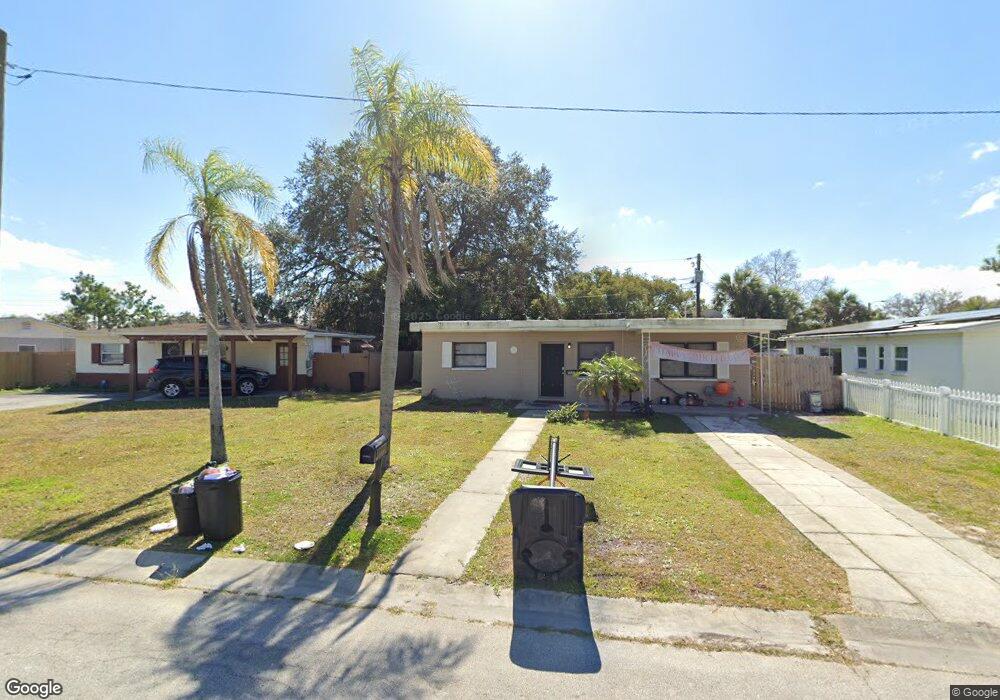
5582 96th Ave Pinellas Park, FL 33782
Estimated Value: $251,000 - $311,000
3
Beds
2
Baths
1,142
Sq Ft
$237/Sq Ft
Est. Value
About This Home
This home is located at 5582 96th Ave, Pinellas Park, FL 33782 and is currently estimated at $271,142, approximately $237 per square foot. 5582 96th Ave is a home located in Pinellas County with nearby schools including Pinellas Central Elementary School, Pinellas Park Middle School, and Pinellas Park High School.
Ownership History
Date
Name
Owned For
Owner Type
Purchase Details
Closed on
Oct 1, 2016
Bought by
C S H 2016-2 Borrower Llc
Current Estimated Value
Purchase Details
Closed on
Feb 20, 2015
Sold by
Polish Investments Inc
Bought by
Fetlar Llc
Purchase Details
Closed on
May 9, 2012
Sold by
Boswell Id John
Bought by
Polish Investments Inc
Purchase Details
Closed on
May 2, 2012
Sold by
Hsbc Mortgage Services Inc
Bought by
Boswell John
Purchase Details
Closed on
Jul 8, 2011
Sold by
Hsbc Mortgage Services Inc
Bought by
Boswel John
Purchase Details
Closed on
Dec 13, 2010
Sold by
Voelker April J
Bought by
Hsbc Mortgage Services Inc
Purchase Details
Closed on
Aug 2, 1999
Sold by
Voelker Mark J
Bought by
Voelker Mark J
Home Financials for this Owner
Home Financials are based on the most recent Mortgage that was taken out on this home.
Original Mortgage
$5,000
Interest Rate
7.66%
Create a Home Valuation Report for This Property
The Home Valuation Report is an in-depth analysis detailing your home's value as well as a comparison with similar homes in the area
Home Values in the Area
Average Home Value in this Area
Purchase History
| Date | Buyer | Sale Price | Title Company |
|---|---|---|---|
| C S H 2016-2 Borrower Llc | $100 | -- | |
| Fetlar Llc | $89,500 | Hillsborough Title Llc | |
| Polish Investments Inc | $71,000 | Jem Title Services Llc | |
| Boswell John | -- | Attorney | |
| Boswel John | $41,000 | Attorney | |
| Hsbc Mortgage Services Inc | -- | None Available | |
| Voelker Mark J | -- | -- |
Source: Public Records
Mortgage History
| Date | Status | Borrower | Loan Amount |
|---|---|---|---|
| Previous Owner | Voelker Mark J | $5,000 |
Source: Public Records
Tax History
| Year | Tax Paid | Tax Assessment Tax Assessment Total Assessment is a certain percentage of the fair market value that is determined by local assessors to be the total taxable value of land and additions on the property. | Land | Improvement |
|---|---|---|---|---|
| 2025 | $3,394 | $169,503 | $97,550 | $71,953 |
| 2024 | $3,324 | $166,266 | $105,765 | $60,501 |
| 2023 | $3,324 | $182,267 | $123,330 | $58,937 |
| 2022 | $2,945 | $149,288 | $99,583 | $49,705 |
| 2021 | $2,662 | $120,444 | $0 | $0 |
| 2020 | $2,524 | $114,770 | $0 | $0 |
| 2019 | $2,318 | $105,132 | $48,739 | $56,393 |
| 2018 | $2,118 | $94,921 | $0 | $0 |
| 2017 | $2,194 | $97,009 | $0 | $0 |
| 2016 | $2,035 | $88,753 | $0 | $0 |
| 2015 | $1,596 | $70,795 | $0 | $0 |
| 2014 | $1,427 | $60,578 | $0 | $0 |
Source: Public Records
Map
Nearby Homes
- 9616 56th St N
- 9493 55th St N
- 5681 94th Terrace N
- 5427 95th Terrace N
- 5511 93rd Ave N
- 9693 58th St N
- 5772 94th Ave
- 5641 92nd Terrace N
- 5301 97th Terrace
- 5600 92nd Terrace N
- 9909 55th Way N
- 5844 95th Ave N
- 9780 53rd St N
- 5834 98th Ave N
- 5834 98th Ave
- 5801 92nd Ave N
- 9402 59th St N
- 5261 99th Terrace N
- 5205 98th Terrace
- 5731 90th Ave N
- 5582 96th Ave N
- 5572 96th Ave
- 9595 56th St N
- 5572 96th Ave N
- 5581 95th Terrace
- 9541 56th Way N
- 9541 56th Way N
- 5565 95th Terrace
- 5591 95th Terrace
- 5583 96th Ave
- 5580 96th Terrace N
- 5580 96th Terrace N
- 5549 95th Terrace
- 5573 96th Ave
- 5573 96th Ave N
- 5549 95th Terrace N
- 5548 96th Ave
- 5561 96th Ave
- 9590 56th St N
- 9560 56th St N
Your Personal Tour Guide
Ask me questions while you tour the home.