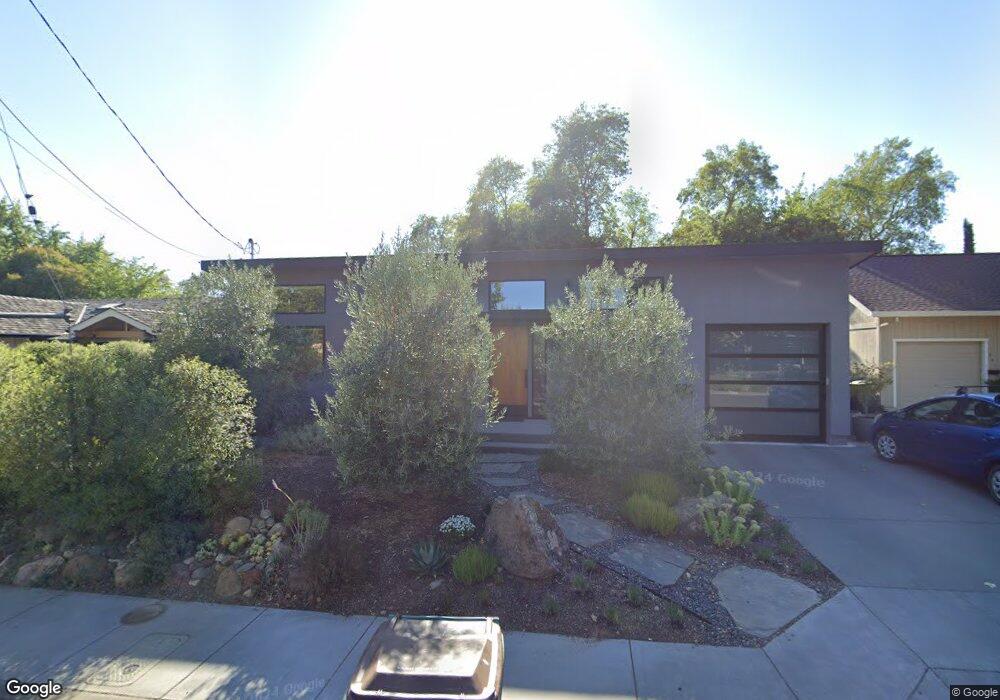
559 Barrachi Way Sonoma, CA 95476
Estimated Value: $1,139,000 - $1,338,000
3
Beds
3
Baths
1,486
Sq Ft
$805/Sq Ft
Est. Value
About This Home
This home is located at 559 Barrachi Way, Sonoma, CA 95476 and is currently estimated at $1,195,763, approximately $804 per square foot. 559 Barrachi Way is a home located in Sonoma County with nearby schools including Sassarini Elementary School, Altimira Middle School, and Creekside High School.
Ownership History
Date
Name
Owned For
Owner Type
Purchase Details
Closed on
Feb 23, 2021
Sold by
Thompson John E and Thompson Dianne M
Bought by
Thompson John E and Thompson Dianne M
Current Estimated Value
Home Financials for this Owner
Home Financials are based on the most recent Mortgage that was taken out on this home.
Original Mortgage
$209,000
Outstanding Balance
$118,321
Interest Rate
3%
Mortgage Type
New Conventional
Estimated Equity
$1,077,442
Purchase Details
Closed on
May 16, 2018
Sold by
Thompson John and Thompson Dianne
Bought by
Thompson John E and Thompson Dianne M
Purchase Details
Closed on
Aug 9, 2017
Sold by
Doherty Marie J and The Marie J Doherty 2003 Trust
Bought by
Thompson John and Thompson Dianne
Purchase Details
Closed on
Sep 17, 2003
Sold by
Doherty Marie J
Bought by
Doherty Marie J and Marie J Doherty 2003 Trust
Create a Home Valuation Report for This Property
The Home Valuation Report is an in-depth analysis detailing your home's value as well as a comparison with similar homes in the area
Home Values in the Area
Average Home Value in this Area
Purchase History
| Date | Buyer | Sale Price | Title Company |
|---|---|---|---|
| Thompson John E | -- | Fidelity National Ttl Group | |
| Thompson John E | -- | None Available | |
| Thompson John | $615,000 | First American Title Company | |
| Doherty Marie J | -- | -- |
Source: Public Records
Mortgage History
| Date | Status | Borrower | Loan Amount |
|---|---|---|---|
| Open | Thompson John E | $209,000 |
Source: Public Records
Tax History Compared to Growth
Tax History
| Year | Tax Paid | Tax Assessment Tax Assessment Total Assessment is a certain percentage of the fair market value that is determined by local assessors to be the total taxable value of land and additions on the property. | Land | Improvement |
|---|---|---|---|---|
| 2025 | $12,659 | $1,027,855 | $455,130 | $572,725 |
| 2024 | $12,659 | $1,007,702 | $446,206 | $561,496 |
| 2023 | $12,659 | $987,944 | $437,457 | $550,487 |
| 2022 | $12,277 | $968,574 | $428,880 | $539,694 |
| 2021 | $12,018 | $661,063 | $420,471 | $240,592 |
| 2020 | $8,624 | $654,286 | $416,160 | $238,126 |
| 2019 | $8,270 | $627,300 | $408,000 | $219,300 |
| 2018 | $8,078 | $615,000 | $400,000 | $215,000 |
| 2017 | $2,877 | $137,734 | $30,598 | $107,136 |
| 2016 | $2,373 | $135,035 | $29,999 | $105,036 |
| 2015 | $2,360 | $133,008 | $29,549 | $103,459 |
| 2014 | $2,309 | $130,404 | $28,971 | $101,433 |
Source: Public Records
Map
Nearby Homes
- 371 W Napa St
- 401 W Napa St Unit 3
- 446 3rd St W
- 15881 Highway 12
- 520 Studley St
- 377 W Spain St
- 337 Bettencourt St
- 443 W Spain St
- 189 Church St
- 424 2nd St W
- 539 Curtin Ln
- 585 Studley St Unit 4
- 443 Casabonne Ln
- 858 Hayes St
- 605 Curtin Ln
- 154 Piper Ln
- 673 2nd St W
- 143 Piper Ln
- Residence 4 Plan at Hummingbird Cottages
- Residence 3 Plan at Hummingbird Cottages
- 569 Barrachi Way
- 551 Barrachi Way
- 583 Barrachi Way
- 566 Barrachi Way
- 556 Barrachi Way
- 543 Barrachi Way
- 580 Barrachi Way
- 336 Banchero St
- 324 Banchero St
- 565 3rd St W
- 555 3rd St W
- 601 Barrachi Way
- 579 3rd St W
- 545 3rd St W
- 381 W Napa St Unit B
- 381 W Napa St Unit A
- 511 3rd St W
- 350 Robinson St
- 371 W Napa St Unit B
- 371 W Napa St Unit A