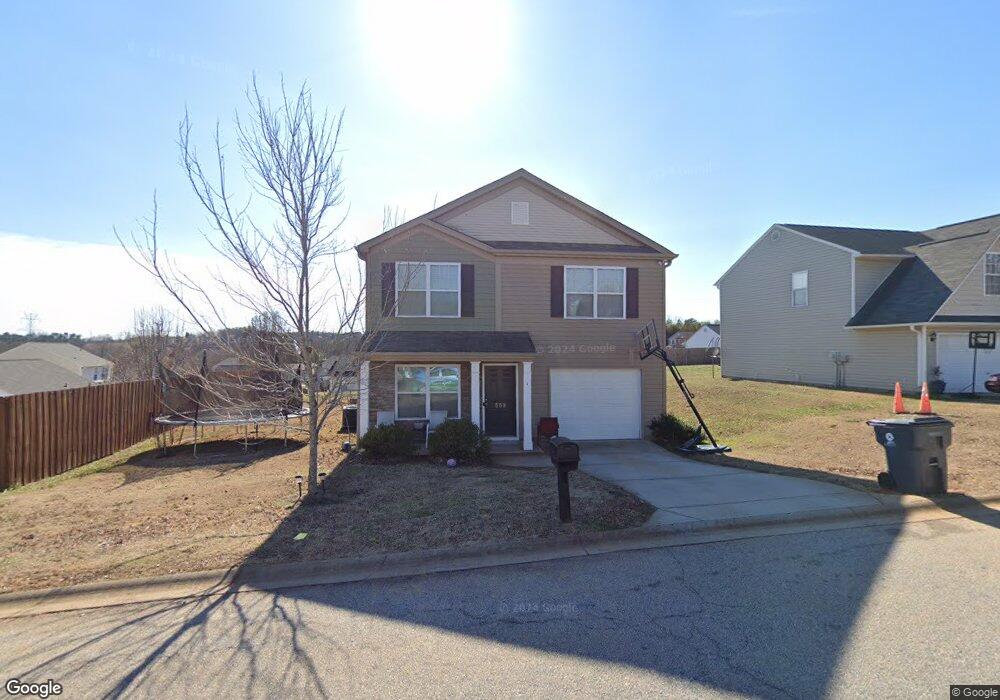
559 Duncan Station Dr Duncan, SC 29334
Estimated Value: $253,000 - $263,369
3
Beds
2
Baths
1,699
Sq Ft
$153/Sq Ft
Est. Value
About This Home
This home is located at 559 Duncan Station Dr, Duncan, SC 29334 and is currently estimated at $259,342, approximately $152 per square foot. 559 Duncan Station Dr is a home located in Spartanburg County with nearby schools including Duncan Elementary School, Byrnes Freshman Academy, and Beech Springs Intermediate School.
Ownership History
Date
Name
Owned For
Owner Type
Purchase Details
Closed on
Apr 24, 2017
Sold by
D R Horton Inc
Bought by
Downs Jamesia L
Current Estimated Value
Home Financials for this Owner
Home Financials are based on the most recent Mortgage that was taken out on this home.
Original Mortgage
$144,214
Outstanding Balance
$119,711
Interest Rate
4.12%
Mortgage Type
FHA
Estimated Equity
$139,631
Purchase Details
Closed on
Jan 18, 2017
Sold by
Cypress Cove Properties Llc
Bought by
D R Horton Inc
Purchase Details
Closed on
Jun 25, 2013
Sold by
The Peoples National Bank Na
Bought by
Cypress Cove Properties Llc
Home Financials for this Owner
Home Financials are based on the most recent Mortgage that was taken out on this home.
Original Mortgage
$180,000
Interest Rate
3.59%
Mortgage Type
Purchase Money Mortgage
Purchase Details
Closed on
Jan 20, 2010
Sold by
Tower Homes Inc
Bought by
The Peoples National Bank
Create a Home Valuation Report for This Property
The Home Valuation Report is an in-depth analysis detailing your home's value as well as a comparison with similar homes in the area
Home Values in the Area
Average Home Value in this Area
Purchase History
| Date | Buyer | Sale Price | Title Company |
|---|---|---|---|
| Downs Jamesia L | $146,875 | None Available | |
| D R Horton Inc | $58,000 | None Available | |
| Cypress Cove Properties Llc | $300,000 | -- | |
| The Peoples National Bank | $578,650 | -- |
Source: Public Records
Mortgage History
| Date | Status | Borrower | Loan Amount |
|---|---|---|---|
| Open | Downs Jamesia L | $144,214 | |
| Previous Owner | Cypress Cove Properties Llc | $180,000 |
Source: Public Records
Tax History Compared to Growth
Tax History
| Year | Tax Paid | Tax Assessment Tax Assessment Total Assessment is a certain percentage of the fair market value that is determined by local assessors to be the total taxable value of land and additions on the property. | Land | Improvement |
|---|---|---|---|---|
| 2025 | $1,534 | $6,753 | $1,253 | $5,500 |
| 2024 | $1,534 | $6,753 | $1,253 | $5,500 |
| 2023 | $1,534 | $6,753 | $1,253 | $5,500 |
| 2022 | $1,380 | $5,872 | $1,000 | $4,872 |
| 2021 | $1,360 | $5,872 | $1,000 | $4,872 |
| 2020 | $1,341 | $5,872 | $1,000 | $4,872 |
| 2019 | $1,329 | $5,872 | $1,000 | $4,872 |
| 2018 | $1,262 | $5,872 | $1,000 | $4,872 |
| 2017 | $104 | $220 | $220 | $0 |
| 2016 | $196 | $330 | $330 | $0 |
| 2015 | $194 | $330 | $330 | $0 |
| 2014 | $194 | $330 | $330 | $0 |
Source: Public Records
Map
Nearby Homes
- 653 Duncan Station Dr
- 113 N Spencer St
- 138 S Church St
- 132 Powder Springs Dr
- 114 N Moore St
- 0 Robinson Rd Unit 318992
- 381 Gap Creek Rd
- 160 Duncanwood Dr
- 768 Cannonsburg Dr
- 108 Lynwood Dr
- 541 Clairbrook Ct
- 170 Spartanburg Rd
- 743 Cannonsburg Dr
- 560 Ward Wilson Trail
- 580 Ward Wilson Trail
- 567 Ward Wilson Trail
- 552 Ward Wilson Trail
- 595 Ward Wilson Trail
- 600 Ward Wilson Trail
- 563 Ward Wilson Trail
- 563 Duncan Station Dr
- 704 Cassie Marie Ct
- 567 Duncan Station Dr
- 562 Duncan Station Dr
- 558 Duncan Station Dr
- 554 Duncan Station Dr
- 708 Cassie Marie Ct
- 566 Duncan Station Dr
- 908 Mary Grace Ln
- 571 Duncan Station Dr
- 916 Mary Grace Ln
- 712 Cassie Marie Ct
- 550 Duncan Station Dr
- 920 Mary Grace Ln
- 709 Cassie Marie Ct
- 705 Cassie Marie Ct
- 221 Ashley Danielle Dr
- 570 Duncan Station Dr
- 911 Mary Grace Ln
- 225 Ashley Danielle Dr