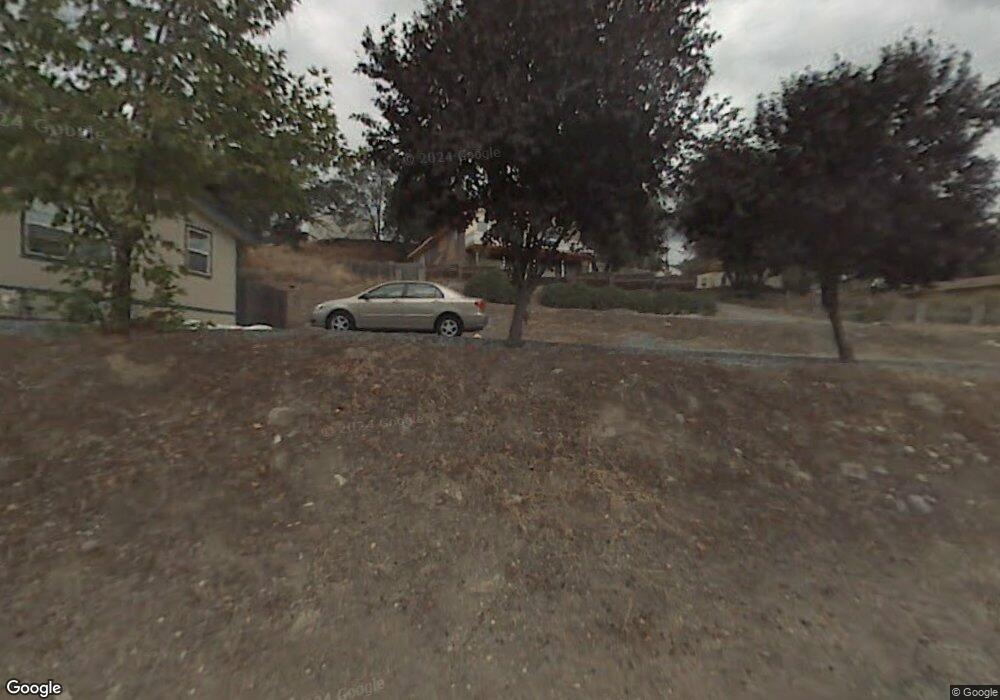
559 Marshall Ave San Andreas, CA 95249
Estimated Value: $292,000 - $445,000
3
Beds
2
Baths
2,521
Sq Ft
$140/Sq Ft
Est. Value
About This Home
This home is located at 559 Marshall Ave, San Andreas, CA 95249 and is currently estimated at $352,514, approximately $139 per square foot. 559 Marshall Ave is a home located in Calaveras County with nearby schools including Jackson Elementary School, Jackson Junior High School, and Argonaut High School.
Ownership History
Date
Name
Owned For
Owner Type
Purchase Details
Closed on
Apr 29, 2020
Sold by
Harris David P and Harris Ramona J
Bought by
Harris David P and Harris Ramona J
Current Estimated Value
Purchase Details
Closed on
Mar 31, 2011
Sold by
Federal Home Loan Mortgage Corporation
Bought by
Harris David P and Harris Ramona J
Purchase Details
Closed on
May 25, 2010
Sold by
Zakharin Peter and Zakharin Paula
Bought by
Federal Home Loan Mortgage Corporation
Purchase Details
Closed on
Nov 1, 2001
Sold by
Citifinancial Services Inc 203 Llc
Bought by
Zakharin Peter and Zakharin Paula
Home Financials for this Owner
Home Financials are based on the most recent Mortgage that was taken out on this home.
Original Mortgage
$124,200
Interest Rate
9.5%
Purchase Details
Closed on
Jul 9, 2001
Sold by
Schatz Joe and Schatz Vera
Bought by
Associates Financial Svcs Co Of Ca Inc
Create a Home Valuation Report for This Property
The Home Valuation Report is an in-depth analysis detailing your home's value as well as a comparison with similar homes in the area
Home Values in the Area
Average Home Value in this Area
Purchase History
| Date | Buyer | Sale Price | Title Company |
|---|---|---|---|
| Harris David P | -- | None Available | |
| Harris David P | $80,000 | First American Title Company | |
| Federal Home Loan Mortgage Corporation | $128,962 | Accommodation | |
| Zakharin Peter | $138,000 | First American Title Ins Co | |
| Associates Financial Svcs Co Of Ca Inc | $115,000 | First American Title Ins Co |
Source: Public Records
Mortgage History
| Date | Status | Borrower | Loan Amount |
|---|---|---|---|
| Previous Owner | Zakharin Peter | $124,200 | |
| Closed | Zakharin Peter | $6,900 |
Source: Public Records
Tax History
| Year | Tax Paid | Tax Assessment Tax Assessment Total Assessment is a certain percentage of the fair market value that is determined by local assessors to be the total taxable value of land and additions on the property. | Land | Improvement |
|---|---|---|---|---|
| 2025 | $1,470 | $102,416 | $19,212 | $83,204 |
| 2023 | $1,445 | $98,441 | $18,467 | $79,974 |
| 2022 | $1,337 | $96,511 | $18,105 | $78,406 |
| 2021 | $1,252 | $94,619 | $17,750 | $76,869 |
| 2020 | $1,104 | $93,649 | $17,568 | $76,081 |
| 2019 | $1,136 | $91,814 | $17,224 | $74,590 |
| 2018 | $1,090 | $90,015 | $16,887 | $73,128 |
| 2017 | $1,068 | $88,251 | $16,556 | $71,695 |
| 2016 | $1,066 | $86,522 | $16,232 | $70,290 |
| 2015 | $1,047 | $85,224 | $15,989 | $69,235 |
| 2014 | -- | $83,555 | $15,676 | $67,879 |
Source: Public Records
Map
Nearby Homes
- 607 Mountain Ranch Rd Unit 7
- 607 Mountain Ranch Rd Unit 19
- 607 Mountain Ranch Rd Unit 2
- 366 Scenic Ct
- 109 Gatewood Ave
- 49 Gatewood Ave
- 291 Sunset St
- 23 W Saint Charles St
- 213 Main St
- 1019 Highway 49
- 363 Sunset St
- 1250 Wimbledon Dr
- 1294 Forest Hill Dr
- 1330 Calaveritas Rd Unit 25
- 1330 Calaveritas Rd Unit 62
- 203 Market St
- 238 E Street Charles St
- 457 Russell Rd
- 1495 Mountain Ranch Rd
- 553 Russell Rd
- 662 Marshall Ave
- 585 Marshall Ave
- 480 Marshall Ave
- 601 Marshall Ave
- 578 Marshall Ave
- 494 Marshall Ave
- 484 Marshall Ave
- 612 Hildebrandt St
- 474 Marshall Ave
- 586 Hildebrandt St
- 588 Marshall Ave
- 470 Marshall Ave
- 613 Marshall Ave
- 622 Hildebrandt St
- 596 Marshall Ave
- 576 Hildebrandt St
- 620 Marshall Ave
- 627 Marshall Ave
- 629 Hildebrandt St
- 587 Hildebrandt St
Your Personal Tour Guide
Ask me questions while you tour the home.