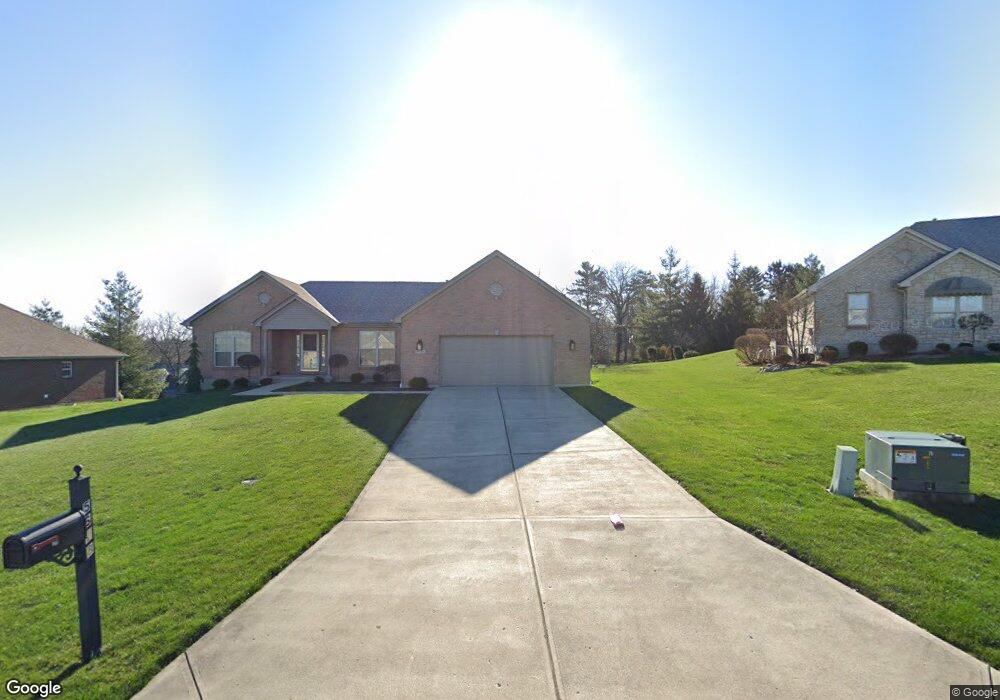
5590 W Fork Rd Cincinnati, OH 45247
West Monfort Heights NeighborhoodEstimated Value: $515,499 - $698,000
3
Beds
3
Baths
2,877
Sq Ft
$197/Sq Ft
Est. Value
About This Home
This home is located at 5590 W Fork Rd, Cincinnati, OH 45247 and is currently estimated at $565,875, approximately $196 per square foot. 5590 W Fork Rd is a home located in Hamilton County with nearby schools including Monfort Heights Elementary School, White Oak Middle School, and Colerain High School.
Ownership History
Date
Name
Owned For
Owner Type
Purchase Details
Closed on
Jul 21, 1995
Sold by
Young Richard A and Young Gail B
Bought by
Bellman James J and Bellman Denise A
Current Estimated Value
Purchase Details
Closed on
Sep 2, 1993
Sold by
Schmidt James M
Bought by
Young Richard A and Young Gail B
Create a Home Valuation Report for This Property
The Home Valuation Report is an in-depth analysis detailing your home's value as well as a comparison with similar homes in the area
Home Values in the Area
Average Home Value in this Area
Purchase History
| Date | Buyer | Sale Price | Title Company |
|---|---|---|---|
| Bellman James J | -- | -- | |
| Young Richard A | -- | -- |
Source: Public Records
Tax History
| Year | Tax Paid | Tax Assessment Tax Assessment Total Assessment is a certain percentage of the fair market value that is determined by local assessors to be the total taxable value of land and additions on the property. | Land | Improvement |
|---|---|---|---|---|
| 2025 | $9,571 | $172,480 | $18,676 | $153,804 |
| 2023 | $9,471 | $172,480 | $18,676 | $153,804 |
| 2022 | $9,163 | $134,128 | $18,190 | $115,938 |
| 2021 | $8,586 | $134,128 | $18,190 | $115,938 |
| 2020 | $8,307 | $134,128 | $18,190 | $115,938 |
| 2019 | $8,222 | $119,756 | $16,240 | $103,516 |
| 2018 | $7,576 | $119,756 | $16,240 | $103,516 |
| 2017 | $7,037 | $119,756 | $16,240 | $103,516 |
| 2016 | $7,158 | $118,721 | $16,202 | $102,519 |
| 2015 | $7,125 | $118,721 | $16,202 | $102,519 |
| 2014 | $7,148 | $118,721 | $16,202 | $102,519 |
| 2013 | $6,767 | $119,921 | $16,366 | $103,555 |
Source: Public Records
Map
Nearby Homes
- 5588 W Fork Rd
- 5563 Haft Rd
- 5876 Sutters Mill Dr
- 5804 Cedaridge Dr
- 5339 Race Rd
- 5991 Gaines Rd
- 6051 Shelrich Ct
- 4643 Whispering Oak Trail
- 5525 Whispering Way
- 5080 Jessup Rd
- 4491 W Fork Rd
- 5547 Hubble Rd
- 4600 Farcrest Ct
- 4192 Timberpoint Dr
- 5182 Michael Anthony Ln
- Site 1 Brierly Creek Rd
- 5220 Valley Ridge Rd
- 4366 Runningfawn Dr
- 6150 Wilmer Rd
- 6130 Wilmer Rd
- 5620 Klausridge Ct
- 5628 Klausridge Ct
- 5592 W Fork Rd
- 5560 W Fork Rd
- 5612 Klausridge Ct
- 5636 Klausridge Ct
- 5644 Klausridge Ct
- 5615 Klausridge Ct
- 5510 W Fork Rd
- 5631 Klausridge Ct
- 5594 W Fork Rd
- 24 W Fork Rd
- 7 W Fork Ridge
- 5652 Klausridge Ct
- 5637 Klausridge Ct
- 5585 W Fork Rd
- 5607 W Fork Rd
- 5645 Klausridge Ct
- 5575 W Fork Rd
- 5636 W Fork Rd
Your Personal Tour Guide
Ask me questions while you tour the home.