55922 Mira St Yucca Valley, CA 92284
Estimated Value: $278,000 - $324,000
1
Bed
1
Bath
1,080
Sq Ft
$273/Sq Ft
Est. Value
About This Home
This home is located at 55922 Mira St, Yucca Valley, CA 92284 and is currently estimated at $295,168, approximately $273 per square foot. 55922 Mira St is a home located in San Bernardino County with nearby schools including Landers Elementary School, La Contenta Middle School, and Yucca Valley High School.
Ownership History
Date
Name
Owned For
Owner Type
Purchase Details
Closed on
Sep 17, 2013
Sold by
Harding Sandra Lynn
Bought by
Bergey David
Current Estimated Value
Purchase Details
Closed on
Jun 29, 2012
Sold by
Stirratt Betty Joy
Bought by
Harding Sandra Lynn
Purchase Details
Closed on
May 5, 2009
Sold by
Stirratt Austin Frank
Bought by
Stirratt Betty Joy and Stirratt Austin Frank
Purchase Details
Closed on
Mar 6, 2009
Sold by
Stirratt Austin F and The Austin F Stirratt Living T
Bought by
Stirratt Austin Frank
Purchase Details
Closed on
Mar 3, 2007
Sold by
Stirratt Austin Frank
Bought by
Stirratt Austin F and The Austin F Stirratt Living T
Purchase Details
Closed on
Jul 2, 2002
Sold by
Stirzaker Ruth
Bought by
Stirzaker Ruth and Goodroad Terry L
Purchase Details
Closed on
May 6, 1997
Sold by
Stirratt Betty J
Bought by
Stirratt Austin Frank
Create a Home Valuation Report for This Property
The Home Valuation Report is an in-depth analysis detailing your home's value as well as a comparison with similar homes in the area
Home Values in the Area
Average Home Value in this Area
Purchase History
| Date | Buyer | Sale Price | Title Company |
|---|---|---|---|
| Bergey David | -- | None Available | |
| Harding Sandra Lynn | -- | None Available | |
| Stirratt Betty Joy | -- | None Available | |
| Stirratt Austin Frank | -- | None Available | |
| Stirratt Austin F | -- | None Available | |
| Stirzaker Ruth | -- | -- | |
| Stirratt Austin Frank | -- | -- |
Source: Public Records
Tax History Compared to Growth
Tax History
| Year | Tax Paid | Tax Assessment Tax Assessment Total Assessment is a certain percentage of the fair market value that is determined by local assessors to be the total taxable value of land and additions on the property. | Land | Improvement |
|---|---|---|---|---|
| 2025 | $1,535 | $110,464 | $23,618 | $86,846 |
| 2024 | $1,535 | $108,298 | $23,155 | $85,143 |
| 2023 | $1,506 | $106,175 | $22,701 | $83,474 |
| 2022 | $1,476 | $104,093 | $22,256 | $81,837 |
| 2021 | $1,459 | $102,052 | $21,820 | $80,232 |
| 2020 | $1,446 | $101,005 | $21,596 | $79,409 |
| 2019 | $1,516 | $99,025 | $21,173 | $77,852 |
| 2018 | $1,344 | $97,083 | $20,758 | $76,325 |
| 2017 | $1,331 | $95,179 | $20,351 | $74,828 |
| 2016 | $1,309 | $93,313 | $19,952 | $73,361 |
| 2015 | -- | $91,911 | $19,652 | $72,259 |
| 2014 | $1,273 | $90,111 | $19,267 | $70,844 |
Source: Public Records
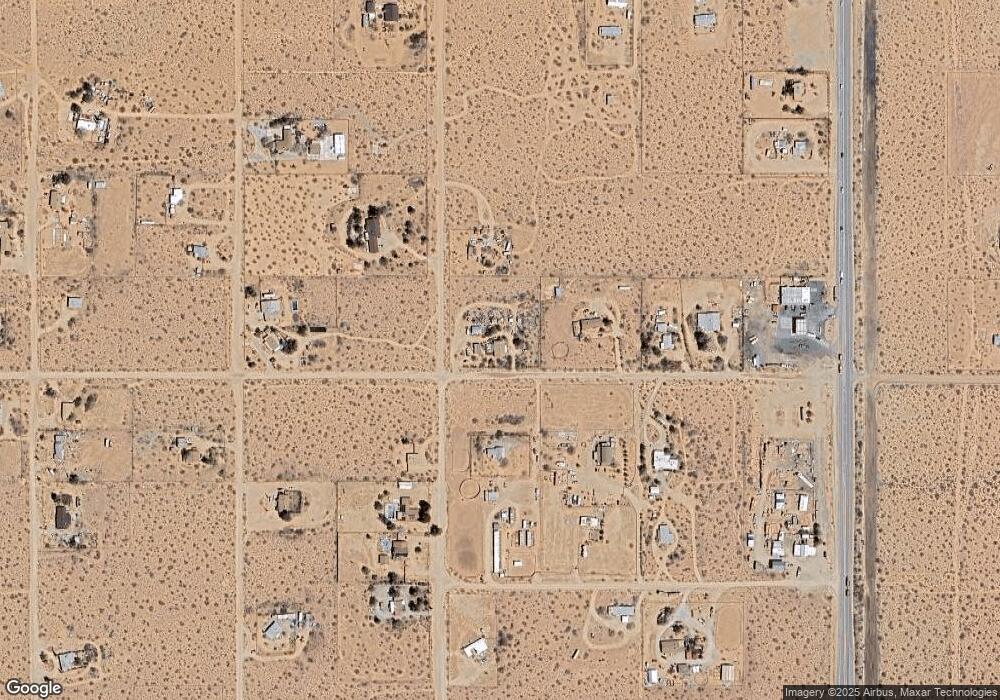
Map
Nearby Homes
- 56011 Mira St
- 382 Cherokee Trail
- 0 Old Woman Unit JT24181190
- 1 Old Woman Springs Rd
- 429 Ripon Ave
- 0 Perris St Unit 25497333PS
- 571 Ripon Ave
- 880 Inca Trail
- 56622 Handley Rd
- 1010 Wamego Trail
- 177 Cherokee Trail
- 56625 Lowe Ave
- 423 Delgada Ave
- 130 Delgada Ave
- 1435 Jemez Trail
- 56045 Vin Rose Ln
- 1266 Cambria Ave Unit 1-2
- 0 Delgada Ave
- 1561 Old Woman Springs Rd
- 1212 Acoma Trail
- 55980 Mira St
- 221 Cherokee Trail
- 55920 Boo Ln
- 227 Cherokee Trail
- 340 Cherokee Trail
- 55984 Boo Ln
- 224 Cherokee Trail
- 56024 Mira St
- 275 Deer Trail
- 365 Deer Trail
- 430 Cherokee Trail
- 419 Cherokee Trail
- 55977 Boo Ln
- 175 Deer Trail
- 389 Deer Trail
- 336 Deer Trail
- 230 Deer Trail
- 56015 Boo Ln
- 55885 Napa St
- 214 Deer Trail