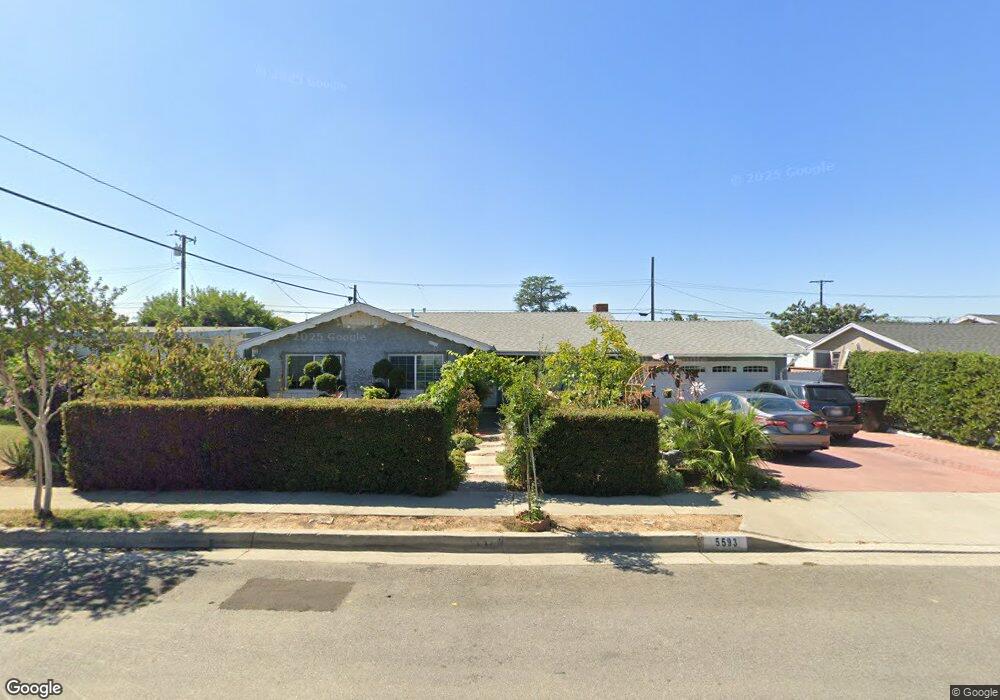
5593 Denver St Montclair, CA 91763
Estimated Value: $648,564 - $726,000
3
Beds
3
Baths
1,546
Sq Ft
$446/Sq Ft
Est. Value
About This Home
This home is located at 5593 Denver St, Montclair, CA 91763 and is currently estimated at $689,391, approximately $445 per square foot. 5593 Denver St is a home located in San Bernardino County with nearby schools including Elderberry Elementary, Vernon Middle School, and Montclair High School.
Ownership History
Date
Name
Owned For
Owner Type
Purchase Details
Closed on
Apr 1, 2016
Sold by
Serna Nancy
Bought by
Serna Richard
Current Estimated Value
Home Financials for this Owner
Home Financials are based on the most recent Mortgage that was taken out on this home.
Original Mortgage
$197,000
Outstanding Balance
$156,196
Interest Rate
3.62%
Mortgage Type
New Conventional
Estimated Equity
$533,195
Purchase Details
Closed on
Mar 17, 1997
Sold by
Hud
Bought by
Serna Richard and Serna Nancy
Home Financials for this Owner
Home Financials are based on the most recent Mortgage that was taken out on this home.
Original Mortgage
$103,100
Interest Rate
7.96%
Mortgage Type
FHA
Purchase Details
Closed on
Oct 3, 1996
Sold by
First Mtg Corp
Bought by
Hud
Purchase Details
Closed on
May 14, 1996
Sold by
Nuno Valente
Bought by
First Mtg Corp
Create a Home Valuation Report for This Property
The Home Valuation Report is an in-depth analysis detailing your home's value as well as a comparison with similar homes in the area
Home Values in the Area
Average Home Value in this Area
Purchase History
| Date | Buyer | Sale Price | Title Company |
|---|---|---|---|
| Serna Richard | -- | Lawyers Title | |
| Serna Richard | $104,000 | Fidelity National Title Ins | |
| Hud | -- | United Title | |
| First Mtg Corp | $102,211 | United Title |
Source: Public Records
Mortgage History
| Date | Status | Borrower | Loan Amount |
|---|---|---|---|
| Open | Serna Richard | $197,000 | |
| Previous Owner | Serna Richard | $103,100 |
Source: Public Records
Tax History
| Year | Tax Paid | Tax Assessment Tax Assessment Total Assessment is a certain percentage of the fair market value that is determined by local assessors to be the total taxable value of land and additions on the property. | Land | Improvement |
|---|---|---|---|---|
| 2025 | $1,797 | $168,976 | $58,632 | $110,344 |
| 2024 | $1,754 | $165,662 | $57,482 | $108,180 |
| 2023 | $1,704 | $162,414 | $56,355 | $106,059 |
| 2022 | $1,680 | $159,229 | $55,250 | $103,979 |
| 2021 | $1,668 | $156,107 | $54,167 | $101,940 |
| 2020 | $1,638 | $154,507 | $53,612 | $100,895 |
| 2019 | $1,622 | $151,478 | $52,561 | $98,917 |
| 2018 | $1,598 | $148,507 | $51,530 | $96,977 |
| 2017 | $1,540 | $145,595 | $50,520 | $95,075 |
| 2016 | $1,478 | $142,740 | $49,529 | $93,211 |
| 2015 | $1,467 | $140,596 | $48,785 | $91,811 |
| 2014 | $1,420 | $137,842 | $47,829 | $90,013 |
Source: Public Records
Map
Nearby Homes
- 10109 Bel Air Ave
- 853 N Jasmine Ave
- 1435 W Rosewood Ct
- 5394 Evart St
- 1319 W D St
- 1353 W Princeton St
- 1255 W D St
- 10018 Geneva Ave
- 1330 W Oakcrest Paseo
- 1326 W Oakcrest Paseo
- 1328 W Oakcrest Paseo
- 1320 W Oakcrest Paseo
- 456 N Begonia Ave
- 9557 Marion Ave
- 10364 Marion Ave
- 9381 Del Mar Ave
- 1163 W Princeton St
- 1335 N Elderberry Ave
- 1446 N Gardenia Ave
- 5555 Caroline St
- 5579 Denver St
- 5607 Denver St
- 10006 Santa Anita Ave
- 10005 Santa Anita Ave
- 5571 Denver St
- 5617 Denver St
- 5606 Denver St
- 10016 Santa Anita Ave
- 10009 Bel Air Ave
- 9970 Santa Anita Ave
- 5616 Denver St
- 5559 Denver St
- 10015 Santa Anita Ave
- 5629 Denver St
- 10021 Bel Air Ave
- 10026 Santa Anita Ave
- 5626 Denver St
- 5593 Granada St
- 9960 Santa Anita Ave
- 5605 Granada St
Your Personal Tour Guide
Ask me questions while you tour the home.