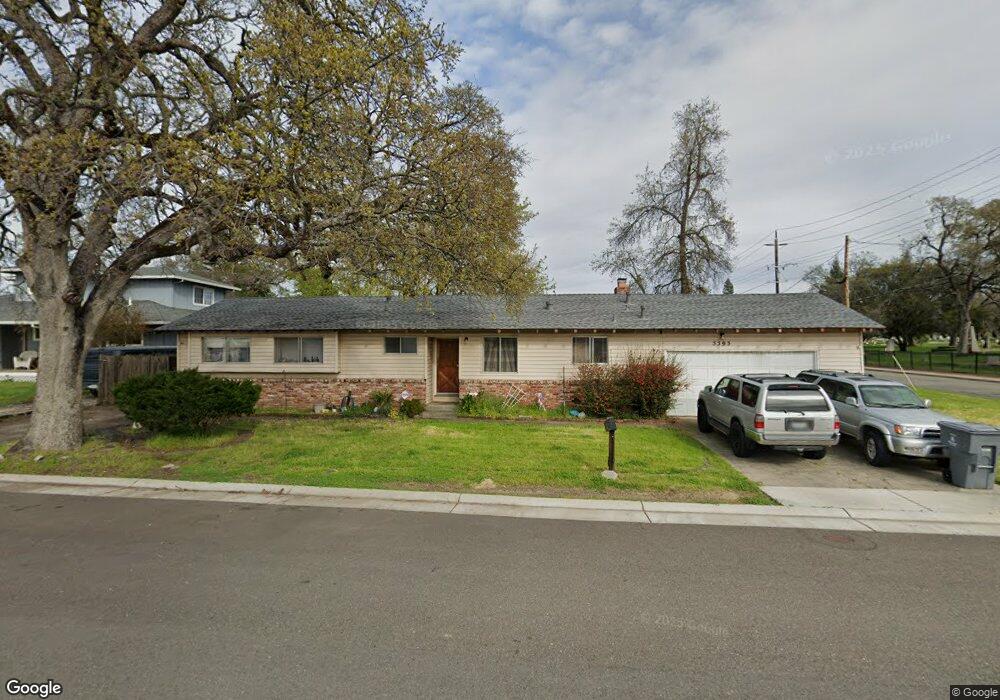
5595 Lost Ave Rocklin, CA 95677
Central Rocklin NeighborhoodEstimated Value: $492,000 - $545,000
4
Beds
2
Baths
1,365
Sq Ft
$379/Sq Ft
Est. Value
About This Home
This home is located at 5595 Lost Ave, Rocklin, CA 95677 and is currently estimated at $517,690, approximately $379 per square foot. 5595 Lost Ave is a home located in Placer County with nearby schools including Rocklin Elementary School, Spring View Middle School, and Rocklin High.
Ownership History
Date
Name
Owned For
Owner Type
Purchase Details
Closed on
Mar 13, 2007
Sold by
Theis Marsha Lynne
Bought by
Theis David and Theis Marsha L
Current Estimated Value
Purchase Details
Closed on
Oct 28, 2005
Sold by
Wofford James Griffin
Bought by
Theis Marsha Lynne
Home Financials for this Owner
Home Financials are based on the most recent Mortgage that was taken out on this home.
Original Mortgage
$217,500
Outstanding Balance
$118,370
Interest Rate
5.93%
Mortgage Type
Credit Line Revolving
Estimated Equity
$399,320
Create a Home Valuation Report for This Property
The Home Valuation Report is an in-depth analysis detailing your home's value as well as a comparison with similar homes in the area
Home Values in the Area
Average Home Value in this Area
Purchase History
| Date | Buyer | Sale Price | Title Company |
|---|---|---|---|
| Theis David | -- | None Available | |
| Theis Marsha Lynne | $290,000 | Alliance Title |
Source: Public Records
Mortgage History
| Date | Status | Borrower | Loan Amount |
|---|---|---|---|
| Open | Theis Marsha Lynne | $217,500 |
Source: Public Records
Tax History
| Year | Tax Paid | Tax Assessment Tax Assessment Total Assessment is a certain percentage of the fair market value that is determined by local assessors to be the total taxable value of land and additions on the property. | Land | Improvement |
|---|---|---|---|---|
| 2025 | $5,660 | $519,286 | $157,148 | $362,138 |
| 2023 | $5,660 | $472,000 | $142,800 | $329,200 |
| 2022 | $4,959 | $442,000 | $133,800 | $308,200 |
| 2021 | $4,436 | $391,000 | $118,300 | $272,700 |
| 2020 | $4,397 | $384,000 | $116,200 | $267,800 |
| 2019 | $4,152 | $360,000 | $108,900 | $251,100 |
| 2018 | $3,912 | $341,000 | $103,200 | $237,800 |
| 2017 | $3,525 | $300,000 | $90,800 | $209,200 |
| 2016 | $3,356 | $288,000 | $87,200 | $200,800 |
| 2015 | $3,183 | $272,000 | $82,300 | $189,700 |
| 2014 | $2,983 | $254,000 | $76,900 | $177,100 |
Source: Public Records
Map
Nearby Homes
- 3819 Anders Way
- 3916 Wickman Loop
- 3808 Anders Way
- 5505 S Grove St Unit 71
- 5505 S Grove St Unit 119
- 5505 S Grove St Unit 316
- 5505 S Grove St Unit 309
- 5505 S Grove St Unit 29
- 5810 Elmwood Ct
- 6005 Woodside Dr
- 5208 Levison Way
- 5235 Pacific St
- 4212 Rockwood St
- 4298 Oakwood St
- 4275 Fernwood St
- 4271 Fernwood St
- 4305 Fernwood St Unit 44
- 4279 Fernwood St Unit 39
- 5500 China Garden Rd
- 3435 C St
Your Personal Tour Guide
Ask me questions while you tour the home.