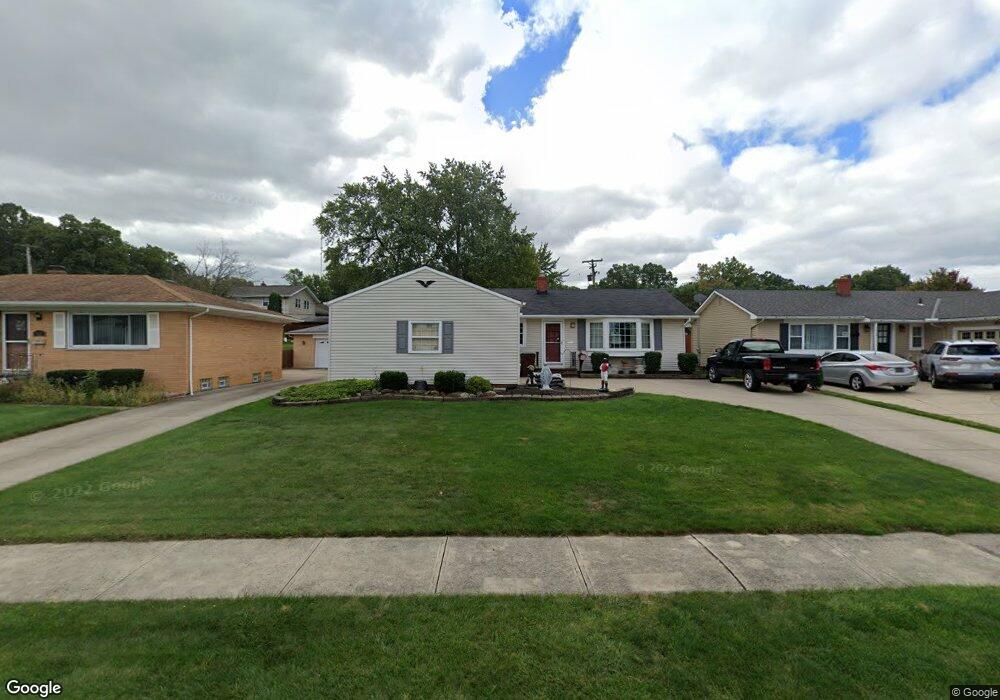
5595 Loyola Dr Cleveland, OH 44129
Estimated Value: $214,792 - $283,000
3
Beds
2
Baths
1,248
Sq Ft
$192/Sq Ft
Est. Value
About This Home
This home is located at 5595 Loyola Dr, Cleveland, OH 44129 and is currently estimated at $239,948, approximately $192 per square foot. 5595 Loyola Dr is a home located in Cuyahoga County with nearby schools including Renwood Elementary School, Hillside Middle School, and Parma High School.
Ownership History
Date
Name
Owned For
Owner Type
Purchase Details
Closed on
May 3, 2013
Sold by
Gedeon Raymond W
Bought by
Mallis Michael G and Mallis Donna M
Current Estimated Value
Purchase Details
Closed on
Apr 16, 2010
Sold by
Gedeon Ann G
Bought by
Gedeon Raymond W
Purchase Details
Closed on
Jun 14, 2001
Sold by
Csuhta Constance R
Bought by
Gedeon Raymond W and Gedeon Ann G
Purchase Details
Closed on
Oct 5, 1998
Sold by
Karas Stanley S and Karas Elizabeth
Bought by
Csuhta Constance R
Home Financials for this Owner
Home Financials are based on the most recent Mortgage that was taken out on this home.
Original Mortgage
$100,000
Interest Rate
6.88%
Purchase Details
Closed on
Feb 11, 1985
Sold by
Karas Karas S S and Karas E
Bought by
Karas Stanley S and Karas Elizabeth
Purchase Details
Closed on
Jan 1, 1975
Bought by
Karas Karas S and Karas E
Create a Home Valuation Report for This Property
The Home Valuation Report is an in-depth analysis detailing your home's value as well as a comparison with similar homes in the area
Home Values in the Area
Average Home Value in this Area
Purchase History
| Date | Buyer | Sale Price | Title Company |
|---|---|---|---|
| Mallis Michael G | $92,750 | Attorney | |
| Gedeon Raymond W | -- | Attorney | |
| Gedeon Raymond W | $128,000 | Northcoast Title Agency | |
| Csuhta Constance R | $125,000 | -- | |
| Karas Stanley S | -- | -- | |
| Karas Karas S | -- | -- |
Source: Public Records
Mortgage History
| Date | Status | Borrower | Loan Amount |
|---|---|---|---|
| Previous Owner | Csuhta Constance R | $100,000 |
Source: Public Records
Tax History Compared to Growth
Tax History
| Year | Tax Paid | Tax Assessment Tax Assessment Total Assessment is a certain percentage of the fair market value that is determined by local assessors to be the total taxable value of land and additions on the property. | Land | Improvement |
|---|---|---|---|---|
| 2024 | $4,003 | $65,555 | $14,560 | $50,995 |
| 2023 | $3,358 | $47,010 | $12,880 | $34,130 |
| 2022 | $3,326 | $47,010 | $12,880 | $34,130 |
| 2021 | $3,421 | $47,010 | $12,880 | $34,130 |
| 2020 | $2,998 | $36,160 | $9,910 | $26,250 |
| 2019 | $2,875 | $103,300 | $28,300 | $75,000 |
| 2018 | $2,661 | $36,160 | $9,910 | $26,250 |
| 2017 | $2,594 | $30,000 | $7,280 | $22,720 |
| 2016 | $2,578 | $30,000 | $7,280 | $22,720 |
| 2015 | $2,468 | $30,000 | $7,280 | $22,720 |
| 2014 | $2,468 | $30,590 | $7,420 | $23,170 |
Source: Public Records
Map
Nearby Homes
- 5700 Hollywood Dr
- 6468 State Rd Unit L11
- 5211 W Ridgewood Dr
- 6510 Belmere Dr
- 6474 State Rd Unit I-10
- 6921 Hollywood Dr
- 5415 Pelham Dr
- 5205 Woodrow Ave
- 5208 Orchard Park Dr
- 6189 W 54th St
- 6431 W Ridgewood Dr
- 4601 W Ridgewood Dr
- 6480 State Rd Unit F10
- 6701 Pelham Dr
- 0 Orchard Park Dr
- 6298 Chestnut Hills Dr
- 4802 Grantwood Dr
- 6474 Ridge Rd
- 4507 Grantwood Dr
- 6234 N Canterbury Rd
- 5555 Loyola Dr
- 5609 Loyola Dr
- 5685 Loyola Dr
- 6396 W 54th St
- 6397 Fordham Dr
- 6403 Fordham Dr
- 5594 Loyola Dr
- 5608 Loyola Dr
- 5508 Loyola Dr
- 5640 Loyola Dr
- 6404 W 54th St
- 6407 Fordham Dr
- 5703 Loyola Dr
- 5696 Loyola Dr
- 5414 Loyola Dr
- 5702 Loyola Dr
- 6411 Fordham Dr
- 6408 W 54th St
- 6396 Fordham Dr
- 5755 Loyola Dr