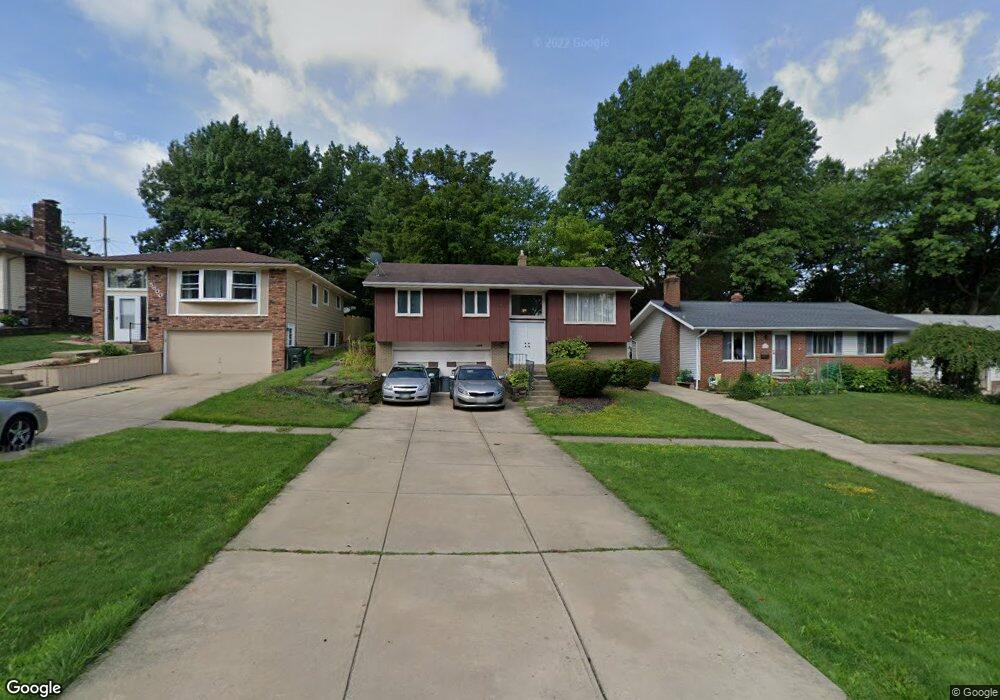
5596 Andover Blvd Cleveland, OH 44125
Estimated Value: $163,000 - $177,764
3
Beds
2
Baths
1,748
Sq Ft
$97/Sq Ft
Est. Value
About This Home
This home is located at 5596 Andover Blvd, Cleveland, OH 44125 and is currently estimated at $169,191, approximately $96 per square foot. 5596 Andover Blvd is a home located in Cuyahoga County with nearby schools including Garfield Heights High School, North Shore High School, and St Benedict Catholic School.
Ownership History
Date
Name
Owned For
Owner Type
Purchase Details
Closed on
Sep 25, 2008
Sold by
Wm Specialty Mortgage Llc
Bought by
Jones Reginda
Current Estimated Value
Home Financials for this Owner
Home Financials are based on the most recent Mortgage that was taken out on this home.
Original Mortgage
$66,374
Outstanding Balance
$44,328
Interest Rate
6.52%
Mortgage Type
FHA
Estimated Equity
$124,863
Purchase Details
Closed on
May 8, 2008
Sold by
Adams Gail Diane
Bought by
Wm Specialty Mortgage Llc
Purchase Details
Closed on
Jun 17, 1988
Sold by
Adams Eleanor M
Bought by
Adams Gail Diane
Purchase Details
Closed on
Mar 5, 1980
Sold by
Adams John E and Adams Eleanor M
Bought by
Adams Eleanor M
Purchase Details
Closed on
Jan 1, 1975
Bought by
Adams John E and Adams Eleanor M
Create a Home Valuation Report for This Property
The Home Valuation Report is an in-depth analysis detailing your home's value as well as a comparison with similar homes in the area
Home Values in the Area
Average Home Value in this Area
Purchase History
| Date | Buyer | Sale Price | Title Company |
|---|---|---|---|
| Jones Reginda | $66,900 | Resource Title Agency | |
| Wm Specialty Mortgage Llc | $63,334 | None Available | |
| Adams Gail Diane | -- | -- | |
| Adams Eleanor M | -- | -- | |
| Adams John E | -- | -- |
Source: Public Records
Mortgage History
| Date | Status | Borrower | Loan Amount |
|---|---|---|---|
| Open | Jones Reginda | $66,374 |
Source: Public Records
Tax History Compared to Growth
Tax History
| Year | Tax Paid | Tax Assessment Tax Assessment Total Assessment is a certain percentage of the fair market value that is determined by local assessors to be the total taxable value of land and additions on the property. | Land | Improvement |
|---|---|---|---|---|
| 2024 | $5,405 | $52,640 | $9,625 | $43,015 |
| 2023 | $4,224 | $38,020 | $6,760 | $31,260 |
| 2022 | $4,172 | $38,010 | $6,755 | $31,255 |
| 2021 | $4,416 | $38,010 | $6,760 | $31,260 |
| 2020 | $3,777 | $30,380 | $5,390 | $24,990 |
| 2019 | $3,744 | $86,800 | $15,400 | $71,400 |
| 2018 | $3,779 | $30,380 | $5,390 | $24,990 |
| 2017 | $3,834 | $29,120 | $4,620 | $24,500 |
| 2016 | $3,891 | $29,120 | $4,620 | $24,500 |
| 2015 | $3,739 | $29,120 | $4,620 | $24,500 |
| 2014 | $3,739 | $30,670 | $4,870 | $25,800 |
Source: Public Records
Map
Nearby Homes
- 5581 Saxon Dr
- 5570 Cumberland Dr
- 5552 Briarcliff Dr
- 11611 Fordham Rd
- 11808 Fordham Rd
- 10808 Mountview Ave
- 11813 Willard Ave
- 12313 Eastwood Blvd
- 12119 Woodward Blvd
- 12214 Woodward Blvd
- 12324 Oak Park Blvd
- 11520 Granger Rd
- 12025 Orme Rd
- 10927 Granger Rd
- 5781 Turney Rd
- 12512 York Blvd
- 11509 Granger Rd
- 12115 Orme Rd
- 12100 Orme Rd
- 11703 Granger Rd
- 5600 Andover Blvd
- 5592 Andover Blvd
- 5604 Andover Blvd
- 5584 Andover Blvd
- 5608 Andover Blvd
- 5611 Saxon Dr
- 5609 Saxon Dr
- 5617 Saxon Dr
- 5612 Andover Blvd
- 5580 Andover Blvd
- 5605 Saxon Dr
- 5621 Saxon Dr
- 5625 Saxon Dr
- 5616 Andover Blvd
- 5576 Andover Blvd
- 5597 Saxon Dr
- 5629 Saxon Dr
- 5572 Andover Blvd
- 5601 Andover Blvd
- 5593 Saxon Dr