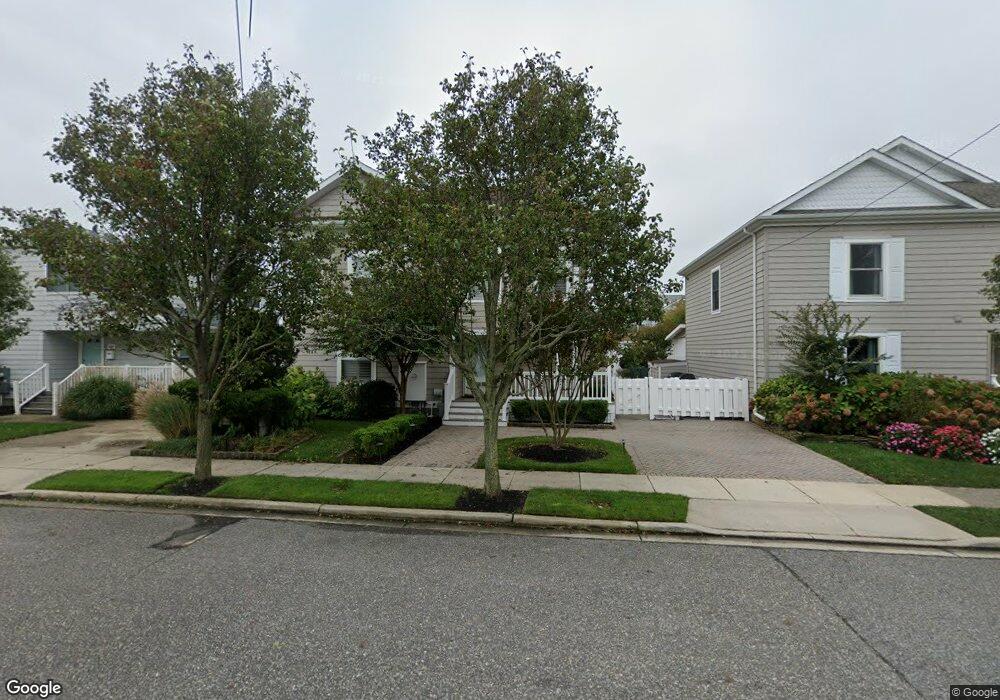
56 18th St W Avalon, NJ 08202
Estimated Value: $2,766,967 - $4,574,000
--
Bed
--
Bath
2,192
Sq Ft
$1,760/Sq Ft
Est. Value
About This Home
This home is located at 56 18th St W, Avalon, NJ 08202 and is currently estimated at $3,858,742, approximately $1,760 per square foot. 56 18th St W is a home located in Cape May County with nearby schools including Avalon Elementary School.
Ownership History
Date
Name
Owned For
Owner Type
Purchase Details
Closed on
Mar 25, 2019
Sold by
Silverman Alan D and Silverman Nancy R
Bought by
Ross H Silverman Irt
Current Estimated Value
Purchase Details
Closed on
Dec 5, 2016
Sold by
Silverman Alan D and Silverman Nancy R
Bought by
Silverman Alan D and Silverman Nancy R
Purchase Details
Closed on
May 12, 2011
Sold by
Silverman Alan David and Silverman Nancy R
Bought by
Silverman Alan D and Silverman Nancy R
Purchase Details
Closed on
Dec 14, 2005
Sold by
Silverman Alan David
Bought by
Silverman Alan David and Silverman Nancy R
Create a Home Valuation Report for This Property
The Home Valuation Report is an in-depth analysis detailing your home's value as well as a comparison with similar homes in the area
Home Values in the Area
Average Home Value in this Area
Purchase History
| Date | Buyer | Sale Price | Title Company |
|---|---|---|---|
| Ross H Silverman Irt | -- | -- | |
| Silverman Alan D | -- | None Available | |
| Silverman Alan D | -- | None Available | |
| Silverman Alan David | -- | None Available |
Source: Public Records
Tax History Compared to Growth
Tax History
| Year | Tax Paid | Tax Assessment Tax Assessment Total Assessment is a certain percentage of the fair market value that is determined by local assessors to be the total taxable value of land and additions on the property. | Land | Improvement |
|---|---|---|---|---|
| 2025 | $7,280 | $1,185,700 | $950,000 | $235,700 |
| 2024 | $7,280 | $1,185,700 | $950,000 | $235,700 |
| 2023 | $7,221 | $1,185,700 | $950,000 | $235,700 |
| 2022 | $6,735 | $1,185,700 | $950,000 | $235,700 |
| 2021 | $6,486 | $1,185,700 | $950,000 | $235,700 |
| 2020 | $6,237 | $1,185,700 | $950,000 | $235,700 |
| 2019 | $6,047 | $1,185,700 | $950,000 | $235,700 |
| 2018 | $5,786 | $1,185,700 | $950,000 | $235,700 |
| 2017 | $5,379 | $967,400 | $850,000 | $117,400 |
| 2016 | $5,321 | $967,400 | $850,000 | $117,400 |
| 2015 | $5,234 | $967,400 | $850,000 | $117,400 |
| 2014 | $5,176 | $967,400 | $850,000 | $117,400 |
Source: Public Records
Map
Nearby Homes