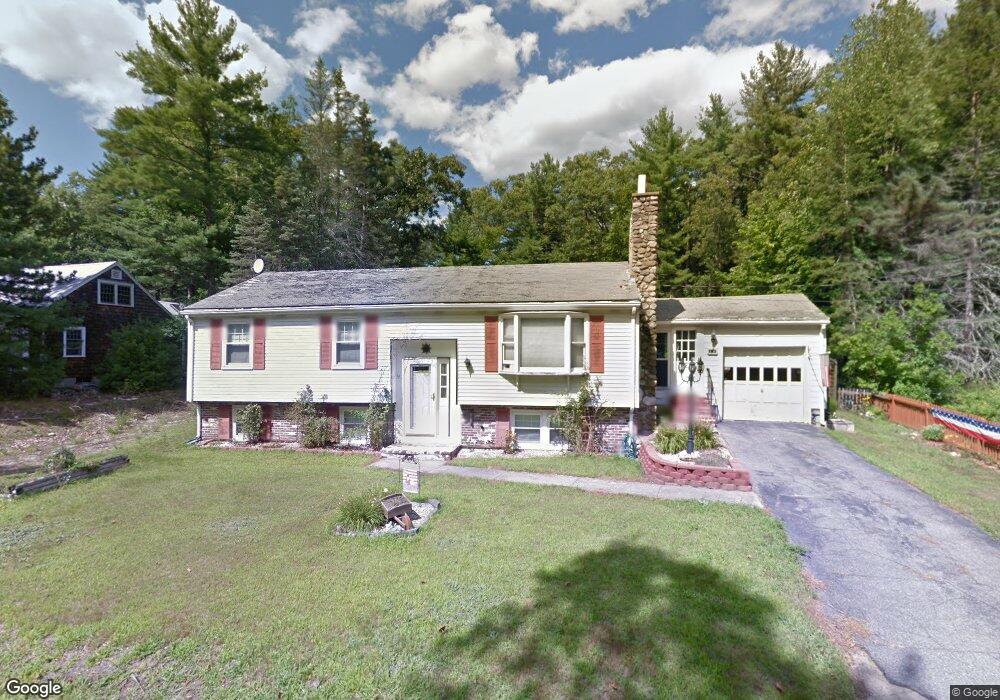
56 Amesbury Rd Newton, NH 03858
Estimated Value: $519,431 - $578,000
3
Beds
2
Baths
1,749
Sq Ft
$315/Sq Ft
Est. Value
About This Home
This home is located at 56 Amesbury Rd, Newton, NH 03858 and is currently estimated at $550,858, approximately $314 per square foot. 56 Amesbury Rd is a home located in Rockingham County with nearby schools including Memorial School, Sanborn Regional Middle School, and Sanborn Regional High School.
Ownership History
Date
Name
Owned For
Owner Type
Purchase Details
Closed on
Jul 10, 2008
Sold by
Rockwood Robert M and Rockwood Janet
Bought by
Leavitt Steven M and Leavitt Sandra L
Current Estimated Value
Home Financials for this Owner
Home Financials are based on the most recent Mortgage that was taken out on this home.
Original Mortgage
$234,600
Outstanding Balance
$151,807
Interest Rate
6.13%
Mortgage Type
Purchase Money Mortgage
Estimated Equity
$399,051
Purchase Details
Closed on
Jan 29, 1999
Sold by
Bergeron Robert B and Bergeron Brenda D
Bought by
Rockwood Robert M and Rockwood Janet
Home Financials for this Owner
Home Financials are based on the most recent Mortgage that was taken out on this home.
Original Mortgage
$122,437
Interest Rate
6.67%
Create a Home Valuation Report for This Property
The Home Valuation Report is an in-depth analysis detailing your home's value as well as a comparison with similar homes in the area
Home Values in the Area
Average Home Value in this Area
Purchase History
| Date | Buyer | Sale Price | Title Company |
|---|---|---|---|
| Leavitt Steven M | $240,000 | -- | |
| Rockwood Robert M | $122,500 | -- |
Source: Public Records
Mortgage History
| Date | Status | Borrower | Loan Amount |
|---|---|---|---|
| Open | Rockwood Robert M | $12,126 | |
| Open | Rockwood Robert M | $234,600 | |
| Previous Owner | Rockwood Robert M | $20,000 | |
| Previous Owner | Rockwood Robert M | $122,437 |
Source: Public Records
Tax History Compared to Growth
Tax History
| Year | Tax Paid | Tax Assessment Tax Assessment Total Assessment is a certain percentage of the fair market value that is determined by local assessors to be the total taxable value of land and additions on the property. | Land | Improvement |
|---|---|---|---|---|
| 2024 | $6,814 | $268,600 | $114,700 | $153,900 |
| 2023 | $6,610 | $268,600 | $114,700 | $153,900 |
| 2022 | $6,041 | $268,600 | $114,700 | $153,900 |
| 2021 | $5,614 | $268,600 | $114,700 | $153,900 |
| 2020 | $5,614 | $268,600 | $114,700 | $153,900 |
| 2019 | $5,411 | $205,100 | $79,700 | $125,400 |
| 2018 | $5,246 | $205,100 | $79,700 | $125,400 |
| 2017 | $5,452 | $205,100 | $79,700 | $125,400 |
| 2016 | $5,365 | $205,100 | $79,700 | $125,400 |
| 2015 | $5,367 | $205,100 | $79,700 | $125,400 |
| 2014 | $5,772 | $222,500 | $87,700 | $134,800 |
| 2013 | $5,629 | $222,500 | $87,700 | $134,800 |
Source: Public Records
Map
Nearby Homes