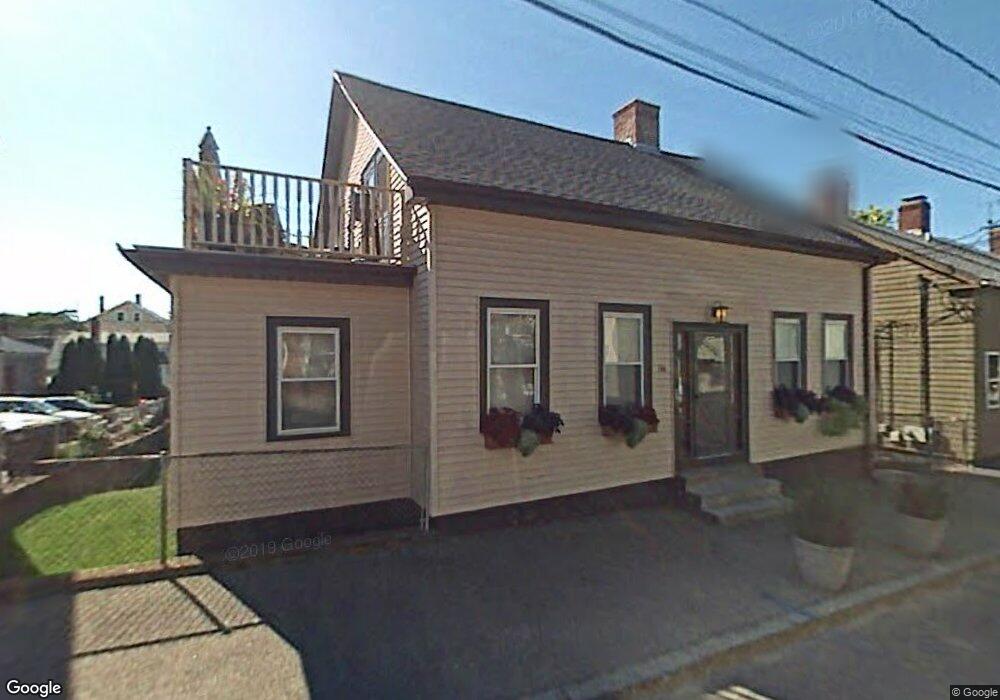
56 Arnold St Unit 2 Providence, RI 02906
Fox Point NeighborhoodEstimated Value: $718,000 - $879,498
2
Beds
1
Bath
704
Sq Ft
$1,172/Sq Ft
Est. Value
About This Home
This home is located at 56 Arnold St Unit 2, Providence, RI 02906 and is currently estimated at $825,375, approximately $1,172 per square foot. 56 Arnold St Unit 2 is a home located in Providence County with nearby schools including French-American School of Rhode Island, Wheeler School, and Moses Brown School.
Ownership History
Date
Name
Owned For
Owner Type
Purchase Details
Closed on
Jun 30, 2004
Sold by
Mota Karen L
Bought by
Laughlin Edward T
Current Estimated Value
Home Financials for this Owner
Home Financials are based on the most recent Mortgage that was taken out on this home.
Original Mortgage
$313,600
Interest Rate
6.3%
Mortgage Type
Purchase Money Mortgage
Create a Home Valuation Report for This Property
The Home Valuation Report is an in-depth analysis detailing your home's value as well as a comparison with similar homes in the area
Home Values in the Area
Average Home Value in this Area
Purchase History
| Date | Buyer | Sale Price | Title Company |
|---|---|---|---|
| Laughlin Edward T | $392,000 | -- |
Source: Public Records
Mortgage History
| Date | Status | Borrower | Loan Amount |
|---|---|---|---|
| Open | Laughlin Edward T | $303,500 | |
| Closed | Laughlin Edward T | $330,400 | |
| Closed | Laughlin Edward T | $313,600 | |
| Closed | Laughlin Edward T | $39,200 |
Source: Public Records
Tax History
| Year | Tax Paid | Tax Assessment Tax Assessment Total Assessment is a certain percentage of the fair market value that is determined by local assessors to be the total taxable value of land and additions on the property. | Land | Improvement |
|---|---|---|---|---|
| 2025 | $5,937 | $786,300 | $448,700 | $337,600 |
| 2024 | $10,715 | $583,900 | $342,700 | $241,200 |
| 2023 | $10,715 | $583,900 | $342,700 | $241,200 |
| 2022 | $10,393 | $583,900 | $342,700 | $241,200 |
| 2021 | $9,473 | $385,700 | $228,800 | $156,900 |
| 2020 | $9,473 | $385,700 | $228,800 | $156,900 |
| 2019 | $9,473 | $385,700 | $228,800 | $156,900 |
| 2018 | $10,090 | $315,700 | $211,000 | $104,700 |
| 2017 | $10,090 | $315,700 | $211,000 | $104,700 |
| 2016 | $10,090 | $315,700 | $211,000 | $104,700 |
| 2015 | $9,529 | $287,900 | $211,000 | $76,900 |
| 2014 | $9,717 | $287,900 | $211,000 | $76,900 |
| 2013 | $9,602 | $284,500 | $211,000 | $73,500 |
Source: Public Records
Map
Nearby Homes
- 323 Wickenden St
- 374 Wickenden St
- 427 Wickenden St
- 20 Governor St
- 16 Governor St
- 38 Transit St Unit 3
- 555 S Main St Unit 321
- 555 S Water St Unit 212
- 42 E Transit St
- 42 Fremont St
- 73 Trenton St
- 14 Amy St
- 670 Wickenden St
- 18 Amy St
- 45 E George St
- 165 Waterman St Unit 2
- 6 Olive St
- 32 Custom House St Unit 201
- 400 Angell St
- 124 Pitman St
Your Personal Tour Guide
Ask me questions while you tour the home.