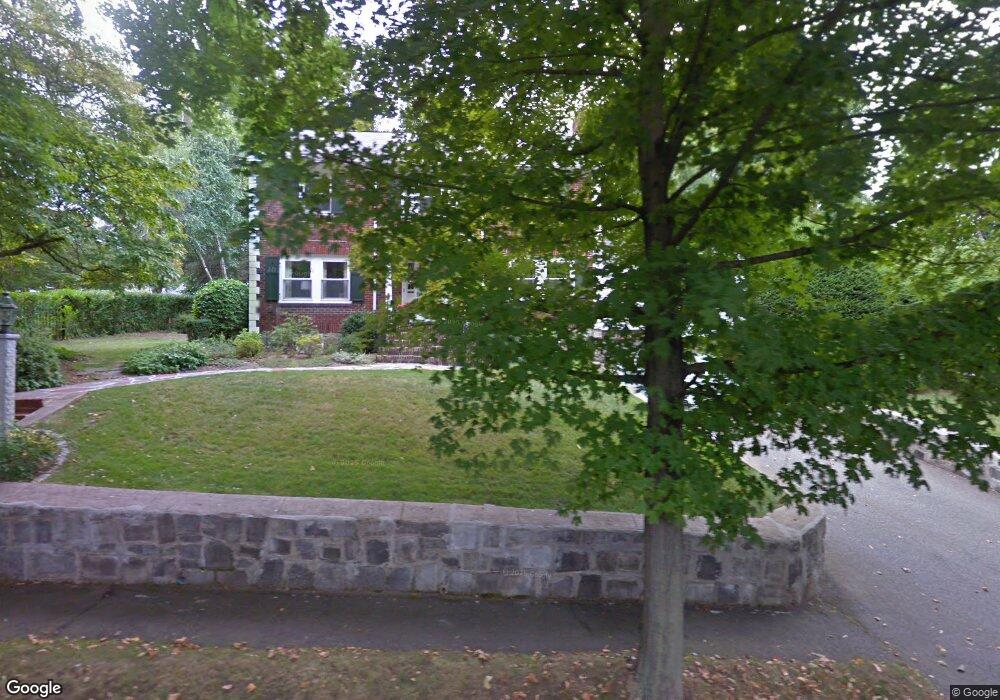
56 Cabot St Milton, MA 02186
Milton Hill NeighborhoodEstimated Value: $1,463,000 - $1,894,000
5
Beds
4
Baths
2,694
Sq Ft
$613/Sq Ft
Est. Value
About This Home
This home is located at 56 Cabot St, Milton, MA 02186 and is currently estimated at $1,650,695, approximately $612 per square foot. 56 Cabot St is a home located in Norfolk County with nearby schools including Milton High School, St. Agatha School, and Milton Academy.
Ownership History
Date
Name
Owned For
Owner Type
Purchase Details
Closed on
Oct 7, 2021
Sold by
English James F and English Sally C
Bought by
James F English Lt
Current Estimated Value
Purchase Details
Closed on
Jul 18, 1990
Sold by
Doria Vincent M
Bought by
English James F
Home Financials for this Owner
Home Financials are based on the most recent Mortgage that was taken out on this home.
Original Mortgage
$320,000
Interest Rate
9.94%
Mortgage Type
Purchase Money Mortgage
Create a Home Valuation Report for This Property
The Home Valuation Report is an in-depth analysis detailing your home's value as well as a comparison with similar homes in the area
Home Values in the Area
Average Home Value in this Area
Purchase History
| Date | Buyer | Sale Price | Title Company |
|---|---|---|---|
| James F English Lt | -- | None Available | |
| English James F | $400,000 | -- |
Source: Public Records
Mortgage History
| Date | Status | Borrower | Loan Amount |
|---|---|---|---|
| Previous Owner | English James F | $100,000 | |
| Previous Owner | English James F | $30,000 | |
| Previous Owner | English James F | $314,000 | |
| Previous Owner | English James F | $320,000 |
Source: Public Records
Tax History
| Year | Tax Paid | Tax Assessment Tax Assessment Total Assessment is a certain percentage of the fair market value that is determined by local assessors to be the total taxable value of land and additions on the property. | Land | Improvement |
|---|---|---|---|---|
| 2025 | $15,427 | $1,391,100 | $649,100 | $742,000 |
| 2024 | $14,854 | $1,360,300 | $618,300 | $742,000 |
| 2023 | $14,424 | $1,265,300 | $588,800 | $676,500 |
| 2022 | $13,903 | $1,114,900 | $588,800 | $526,100 |
| 2021 | $13,491 | $1,027,500 | $526,400 | $501,100 |
| 2020 | $13,357 | $1,018,100 | $526,300 | $491,800 |
| 2019 | $13,028 | $988,500 | $511,000 | $477,500 |
| 2018 | $11,636 | $842,600 | $374,100 | $468,500 |
| 2017 | $10,883 | $802,600 | $356,300 | $446,300 |
| 2016 | $10,708 | $793,200 | $356,300 | $436,900 |
| 2015 | $10,672 | $765,600 | $311,800 | $453,800 |
Source: Public Records
Map
Nearby Homes
- 52 California Ave
- 400 Adams St Unit A
- 397 Adams St
- 1185 Brook Rd
- 0 Franklin St
- 46 Century Ln
- 85 Forbes Rd
- 440 Granite Ave Unit 201
- 41 Wallace Rd
- 281 Elmwood Ave
- 88 Wharf St Unit 105
- 84 Gardiner Rd
- 114 Willard St Unit 4
- 154 N Central Ave
- 115 W Squantum St Unit 517
- 115 W Squantum St Unit 811
- 1245 Adams St Unit B503
- 61 Hill Top St
- 1241-1255 Adams St Unit F213
- 1241-1255 Adams St Unit B302
Your Personal Tour Guide
Ask me questions while you tour the home.