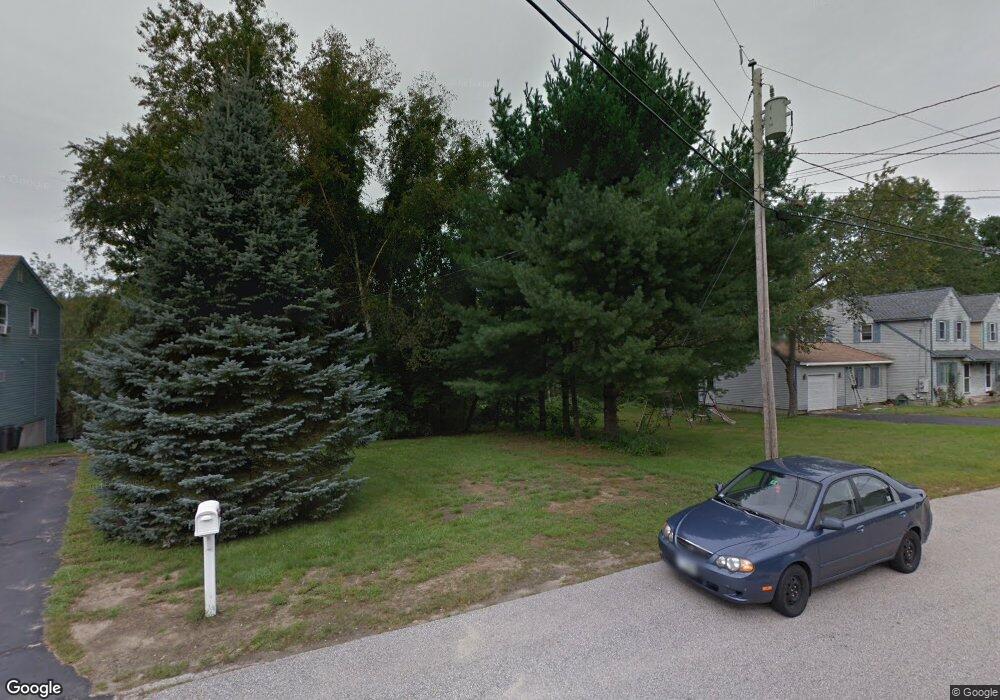
56 Dale Rd Unit A Hooksett, NH 03106
Estimated Value: $335,449 - $417,000
2
Beds
2
Baths
1,090
Sq Ft
$353/Sq Ft
Est. Value
About This Home
This home is located at 56 Dale Rd Unit A, Hooksett, NH 03106 and is currently estimated at $384,362, approximately $352 per square foot. 56 Dale Rd Unit A is a home located in Merrimack County with nearby schools including Fred C. Underhill School, Hooksett Memorial School, and David R. Cawley Middle School.
Ownership History
Date
Name
Owned For
Owner Type
Purchase Details
Closed on
Oct 26, 2017
Sold by
Kazanowski Karen
Bought by
Karen L Kazanowski Ret
Current Estimated Value
Purchase Details
Closed on
May 19, 2016
Sold by
Zarakotas Mark A and Zarakotas Christina
Bought by
Kazanowski Karen
Home Financials for this Owner
Home Financials are based on the most recent Mortgage that was taken out on this home.
Original Mortgage
$190,231
Interest Rate
3.59%
Mortgage Type
New Conventional
Purchase Details
Closed on
Jan 26, 2004
Sold by
Bernier Michael P
Bought by
Zarakotas Mark A and Zarakotas Christina
Home Financials for this Owner
Home Financials are based on the most recent Mortgage that was taken out on this home.
Original Mortgage
$155,500
Interest Rate
5.89%
Mortgage Type
Purchase Money Mortgage
Create a Home Valuation Report for This Property
The Home Valuation Report is an in-depth analysis detailing your home's value as well as a comparison with similar homes in the area
Home Values in the Area
Average Home Value in this Area
Purchase History
| Date | Buyer | Sale Price | Title Company |
|---|---|---|---|
| Karen L Kazanowski Ret | -- | -- | |
| Kazanowski Karen | $185,000 | -- | |
| Zarakotas Mark A | $172,900 | -- |
Source: Public Records
Mortgage History
| Date | Status | Borrower | Loan Amount |
|---|---|---|---|
| Previous Owner | Kazanowski Karen | $190,231 | |
| Previous Owner | Zarakotas Mark A | $155,500 |
Source: Public Records
Tax History
| Year | Tax Paid | Tax Assessment Tax Assessment Total Assessment is a certain percentage of the fair market value that is determined by local assessors to be the total taxable value of land and additions on the property. | Land | Improvement |
|---|---|---|---|---|
| 2024 | $5,331 | $314,300 | $71,700 | $242,600 |
| 2023 | $5,016 | $313,900 | $71,300 | $242,600 |
| 2022 | $4,478 | $186,200 | $48,800 | $137,400 |
| 2021 | $4,137 | $186,200 | $48,800 | $137,400 |
| 2020 | $4,191 | $186,200 | $48,800 | $137,400 |
| 2019 | $4,013 | $186,200 | $48,800 | $137,400 |
| 2018 | $4,119 | $186,200 | $48,800 | $137,400 |
| 2017 | $4,038 | $151,000 | $44,900 | $106,100 |
| 2016 | $3,985 | $151,000 | $44,900 | $106,100 |
| 2015 | $3,594 | $145,400 | $44,900 | $100,500 |
| 2014 | $3,610 | $145,400 | $44,900 | $100,500 |
| 2013 | $3,414 | $145,400 | $44,900 | $100,500 |
Source: Public Records
Map
Nearby Homes
- 1601 Hooksett Rd
- 8 Short Ave
- 1465 Hooksett Rd Unit 418
- 1465 Hooksett Rd Unit 183
- 1465 Hooksett Rd Unit 390
- 1465 Hooksett Rd Unit 41
- 12 Chase St
- 5 Cross Rd
- 245 W River Rd
- 1821 Hooksett Rd
- 117 Merrimack St
- 59 Post Rd
- 131 Merrimack St
- 2 Brandywine Dr
- 32 Lindsay Rd
- 5 Thistle Ln
- 0 Chester Turnpike Unit 18
- 315 Hackett Hill Rd
- 8 Park St
- 7 Oak St
- 52 Dale Rd Unit B
- 52 Dale Rd Unit A
- 56 Dale Rd Unit B
- 56 Dale Rd Unit 56A
- 52 Dale Rd
- 52 Dale Rd Unit 52A
- 53 Dale Rd Unit B
- 53 Dale Rd Unit A
- 50b Dale Rd Unit 1
- 50b Dale Rd
- 55 Dale Rd Unit B
- 55 Dale Rd Unit A
- 51 Dale Rd Unit B
- 51 Dale Rd Unit A
- 55 Dale Rd Unit 2
- 51 Dale Rd
- 55 Dale Rd
- 54 Dale Rd Unit B
- 54 Dale Rd Unit A
- 50 Dale Rd Unit B
Your Personal Tour Guide
Ask me questions while you tour the home.