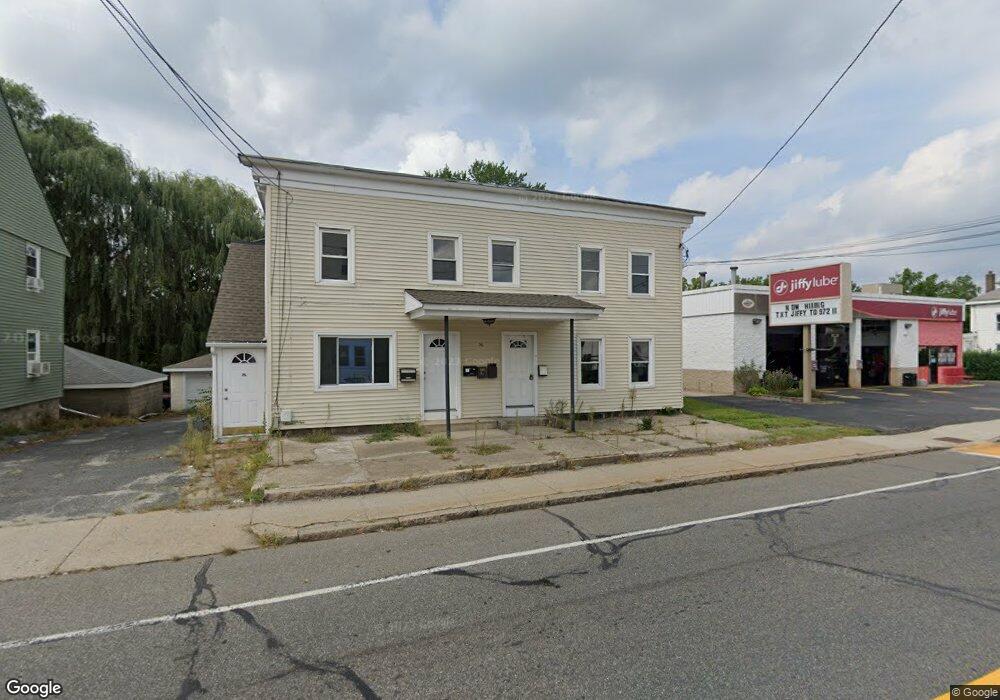
56 E Main St Milford, MA 01757
Estimated Value: $584,976 - $779,000
About This Home
This home is located at 56 E Main St, Milford, MA 01757 and is currently estimated at $644,994, approximately $205 per square foot. 56 E Main St is a home located in Worcester County with nearby schools including Milford High School and Bethany Christian Academy.
Ownership History
We collect this data history from publicly available records. To have your information removed, we recommend requesting removal directly through your county’s website.
Purchase Details
Home Financials for this Owner
Home Financials are based on the most recent Mortgage that was taken out on this home.Purchase Details
Home Financials for this Owner
Home Financials are based on the most recent Mortgage that was taken out on this home.Home Values in the Area
Average Home Value in this Area
Purchase History
We collect this data history from publicly available records. To have your information removed, we recommend requesting removal directly through your county’s website.
| Date | Buyer | Sale Price | Title Company |
|---|---|---|---|
| $250,000 | -- | ||
| $110,000 | -- |
Mortgage History
We collect this data history from publicly available records. To have your information removed, we recommend requesting removal directly through your county’s website.
| Date | Status | Borrower | Loan Amount |
|---|---|---|---|
| Open | $245,000 | ||
| Closed | $200,000 | ||
| Previous Owner | $98,000 | ||
| Previous Owner | $80,000 |
Tax History
We collect this data history from publicly available records. To have your information removed, we recommend requesting removal directly through your county’s website.
| Year | Tax Paid | Tax Assessment Tax Assessment Total Assessment is a certain percentage of the fair market value that is determined by local assessors to be the total taxable value of land and additions on the property. | Land | Improvement |
|---|---|---|---|---|
| 2025 | $7,300 | $570,300 | $153,900 | $416,400 |
| 2024 | $5,837 | $439,200 | $146,800 | $292,400 |
| 2023 | $5,034 | $348,400 | $123,500 | $224,900 |
| 2022 | $4,919 | $319,600 | $112,800 | $206,800 |
| 2021 | $4,663 | $291,800 | $112,800 | $179,000 |
| 2020 | $4,568 | $286,200 | $112,800 | $173,400 |
| 2019 | $4,403 | $266,200 | $112,800 | $153,400 |
| 2018 | $3,878 | $234,200 | $107,400 | $126,800 |
| 2017 | $3,759 | $223,900 | $107,400 | $116,500 |
| 2016 | $3,587 | $208,800 | $96,600 | $112,200 |
| 2015 | $3,603 | $205,300 | $93,100 | $112,200 |
Map
- 17 Carroll St
- 30 Cedarview Cir Unit 30
- 20 Cedarview Cir
- 13 Spring St
- 16 Hamilton Ave
- 33 Purchase St Unit A
- 276 Central St
- 9 Prairie St
- 77-79 Congress St
- 38 Depot St
- 126 W Spruce St
- 190 E Main St
- 4 W Pine St
- 11 Aris Way
- 39 Stallbrook Rd
- 6 Gibbons
- 6 Bear Hill Rd
- 7 S Main St
- 2 Walker Ave
- 38 Pleasant St
Ask me questions while you tour the home.