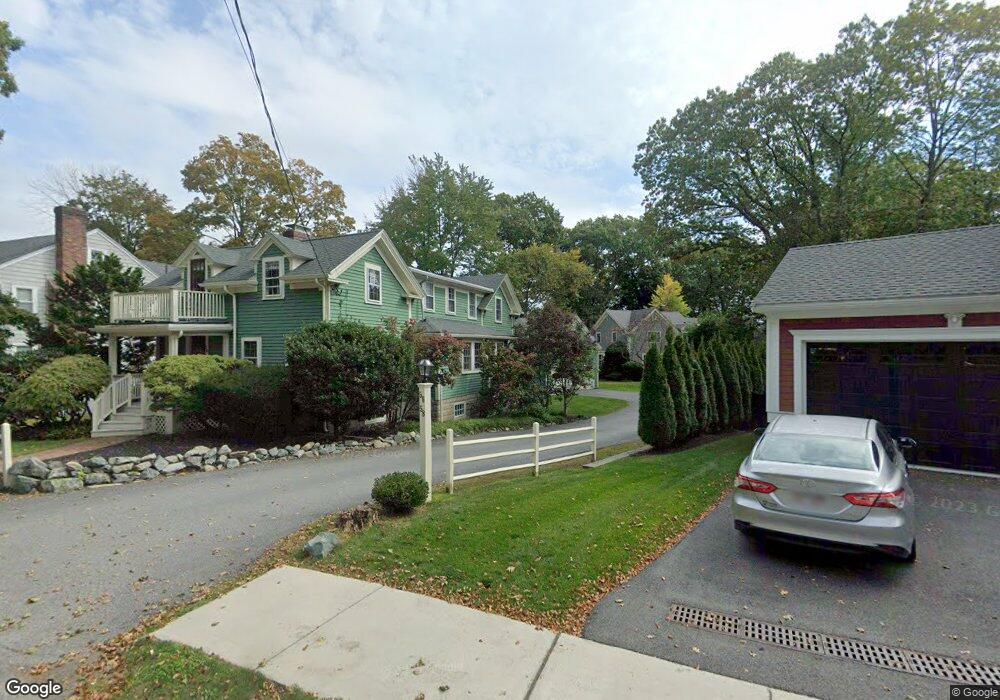
56 Fuller St Unit 56 56 Waban, MA 02468
Waban NeighborhoodEstimated Value: $1,354,874 - $1,526,000
3
Beds
3
Baths
2,896
Sq Ft
$507/Sq Ft
Est. Value
About This Home
This home is located at 56 Fuller St Unit 56 56, Waban, MA 02468 and is currently estimated at $1,468,469, approximately $507 per square foot. 56 Fuller St Unit 56 56 is a home located in Middlesex County with nearby schools including Zervas Elementary School, Oak Hill Middle School, and Newton South High School.
Ownership History
Date
Name
Owned For
Owner Type
Purchase Details
Closed on
Oct 1, 2019
Sold by
Cohen Allison B
Bought by
Allison Baker Cohen Ret
Current Estimated Value
Purchase Details
Closed on
Sep 13, 2019
Sold by
Cohen Aaron J and Baker-Cohen Allison
Bought by
Baker-Cohen Allison
Purchase Details
Closed on
Mar 26, 2008
Sold by
Cohen Aaron J and Cohen Allison Baker
Bought by
Cohen Aaron J and Cohen Allison Baker
Purchase Details
Closed on
Dec 13, 2001
Sold by
Michelson Alan M and Michelson Donna S
Bought by
Baker Allison and Cohen Aaron
Home Financials for this Owner
Home Financials are based on the most recent Mortgage that was taken out on this home.
Original Mortgage
$150,000
Interest Rate
6.6%
Mortgage Type
Purchase Money Mortgage
Purchase Details
Closed on
Nov 15, 1988
Sold by
Burrington Rt
Bought by
Copass Leah J
Create a Home Valuation Report for This Property
The Home Valuation Report is an in-depth analysis detailing your home's value as well as a comparison with similar homes in the area
Home Values in the Area
Average Home Value in this Area
Purchase History
| Date | Buyer | Sale Price | Title Company |
|---|---|---|---|
| Allison Baker Cohen Ret | -- | -- | |
| Allison Baker Cohen Ret | -- | -- | |
| Baker-Cohen Allison | -- | -- | |
| Baker-Cohen Allison | -- | -- | |
| Cohen Aaron J | -- | -- | |
| Cohen Aaron J | -- | -- | |
| Cohen Aaron J | -- | -- | |
| Baker Allison | $600,000 | -- | |
| Copass Leah J | $384,000 | -- |
Source: Public Records
Mortgage History
| Date | Status | Borrower | Loan Amount |
|---|---|---|---|
| Previous Owner | Copass Leah J | $150,000 | |
| Previous Owner | Copass Leah J | $227,150 |
Source: Public Records
Tax History Compared to Growth
Tax History
| Year | Tax Paid | Tax Assessment Tax Assessment Total Assessment is a certain percentage of the fair market value that is determined by local assessors to be the total taxable value of land and additions on the property. | Land | Improvement |
|---|---|---|---|---|
| 2025 | $10,479 | $1,069,300 | $0 | $1,069,300 |
| 2024 | $10,133 | $1,038,200 | $0 | $1,038,200 |
| 2023 | $9,902 | $972,700 | $0 | $972,700 |
| 2022 | $9,746 | $926,400 | $0 | $926,400 |
| 2021 | $9,404 | $874,000 | $0 | $874,000 |
| 2020 | $9,125 | $874,000 | $0 | $874,000 |
| 2019 | $8,867 | $848,500 | $0 | $848,500 |
| 2018 | $8,903 | $822,800 | $0 | $822,800 |
| 2017 | $8,631 | $776,200 | $0 | $776,200 |
| 2016 | $8,255 | $725,400 | $0 | $725,400 |
| 2015 | $8,021 | $690,900 | $0 | $690,900 |
Source: Public Records
Map
Nearby Homes
- 36 Troy Ln
- 308 Prince St
- 1230 Commonwealth Ave
- 222 Prince St
- 513 Chestnut St
- 39 Valentine Park
- 1430 Beacon St
- 25 Allen Ave
- 10 Ruane Rd
- 115 Windsor Rd
- 80 Pine Ridge Rd
- 18 Sewall St
- 40 Sewall St
- 154 Beaumont Ave
- 61 Lakeview Ave
- 20 Kinmonth Rd Unit 203
- 20 Kinmonth Rd Unit 306
- 12 Inis Cir
- 26 Wilson Cir Unit 26
- 1114 Beacon St Unit 106
- 56 Fuller St
- 54 Fuller St
- 64 Fuller St
- 8 Coyne Rd Unit 10
- 8 Coyne Rd Unit 1
- 8-A Coyne Rd
- 10 Coyne Rd
- 44 Fuller St
- 46 Fuller St Unit 46
- 58 Fuller St
- 17 Cotter Rd
- 15 Cotter Rd
- 15 Cotter Rd Unit 2
- 15 Cotter Rd Unit 1
- 53 Fuller St
- 21 Cotter Rd
- 12 Coyne Rd Unit 14
- 14 Coyne Rd Unit B
- 14 Coyne Rd
- 12 Coyne Rd Unit A