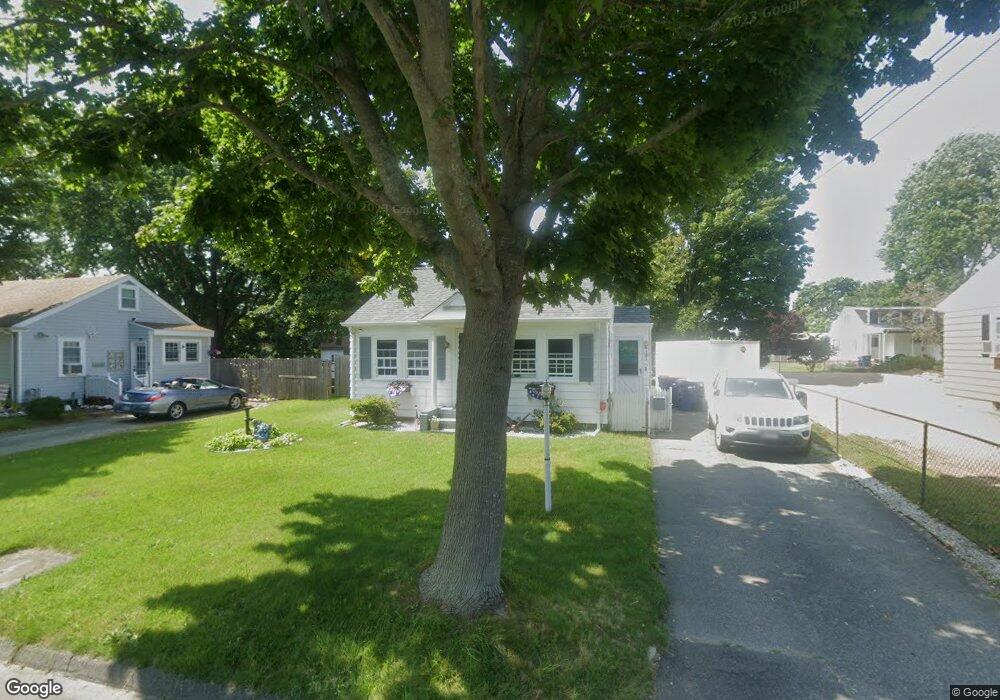
56 Hacker St Fairhaven, MA 02719
Pope Beach NeighborhoodEstimated Value: $286,000 - $430,000
3
Beds
1
Bath
649
Sq Ft
$557/Sq Ft
Est. Value
About This Home
This home is located at 56 Hacker St, Fairhaven, MA 02719 and is currently estimated at $361,403, approximately $556 per square foot. 56 Hacker St is a home located in Bristol County with nearby schools including Fairhaven High School, City On A Hill Charter Public School New Bedford, and St. Joseph School.
Ownership History
Date
Name
Owned For
Owner Type
Purchase Details
Closed on
Jun 29, 2015
Sold by
Mello Penelope J
Bought by
Midura Kimberly J
Current Estimated Value
Home Financials for this Owner
Home Financials are based on the most recent Mortgage that was taken out on this home.
Original Mortgage
$85,000
Outstanding Balance
$66,232
Interest Rate
3.84%
Mortgage Type
New Conventional
Estimated Equity
$295,171
Create a Home Valuation Report for This Property
The Home Valuation Report is an in-depth analysis detailing your home's value as well as a comparison with similar homes in the area
Home Values in the Area
Average Home Value in this Area
Purchase History
| Date | Buyer | Sale Price | Title Company |
|---|---|---|---|
| Midura Kimberly J | $8,988 | -- | |
| Midura Kimberly J | $98,012 | -- |
Source: Public Records
Mortgage History
| Date | Status | Borrower | Loan Amount |
|---|---|---|---|
| Open | Midura Kimberly J | $85,000 |
Source: Public Records
Tax History
| Year | Tax Paid | Tax Assessment Tax Assessment Total Assessment is a certain percentage of the fair market value that is determined by local assessors to be the total taxable value of land and additions on the property. | Land | Improvement |
|---|---|---|---|---|
| 2025 | $28 | $302,400 | $170,300 | $132,100 |
| 2024 | $2,655 | $287,600 | $170,300 | $117,300 |
| 2023 | $2,527 | $254,000 | $149,200 | $104,800 |
| 2022 | $2,404 | $235,200 | $138,600 | $96,600 |
| 2021 | $2,281 | $202,000 | $125,400 | $76,600 |
| 2020 | $2,234 | $202,000 | $125,400 | $76,600 |
| 2019 | $2,089 | $179,000 | $104,000 | $75,000 |
| 2018 | $1,981 | $168,600 | $99,000 | $69,600 |
| 2017 | $1,965 | $163,200 | $99,000 | $64,200 |
| 2016 | $1,946 | $159,800 | $99,000 | $60,800 |
| 2015 | $1,921 | $158,100 | $99,000 | $59,100 |
Source: Public Records
Map
Nearby Homes
- 58 Bayview Ave
- 27 Bayview Ave
- 15 Bayview Ave
- 3.5 Golf St
- 190 Sconticut Neck Rd
- 00 Copeland St
- 00 Huttleston Ave
- 8 Manor Dr
- 33 Narragansett Blvd
- 181 Washington St
- 2 Washburn Ave
- 11 Lawton St
- 5 Reservation Rd
- 145 Pleasant St
- 32 Cedar St
- 77 Adams St
- 32 Green St
- 58 Washington St
- 39 Christian St
- 0 Nulands Neck Unit 73286360
Your Personal Tour Guide
Ask me questions while you tour the home.