56 Indian Trail Pembroke, MA 02359
Estimated Value: $488,000 - $522,991
3
Beds
1
Bath
1,159
Sq Ft
$431/Sq Ft
Est. Value
About This Home
This home is located at 56 Indian Trail, Pembroke, MA 02359 and is currently estimated at $498,998, approximately $430 per square foot. 56 Indian Trail is a home located in Plymouth County with nearby schools including Pembroke High School and Cardinal Cushing Centers.
Ownership History
Date
Name
Owned For
Owner Type
Purchase Details
Closed on
Aug 16, 2006
Sold by
Demullis Arthur R and Demullis Glenda R
Bought by
Demullis Glenda R
Current Estimated Value
Home Financials for this Owner
Home Financials are based on the most recent Mortgage that was taken out on this home.
Original Mortgage
$85,000
Outstanding Balance
$51,365
Interest Rate
6.88%
Mortgage Type
Purchase Money Mortgage
Estimated Equity
$447,633
Create a Home Valuation Report for This Property
The Home Valuation Report is an in-depth analysis detailing your home's value as well as a comparison with similar homes in the area
Home Values in the Area
Average Home Value in this Area
Purchase History
| Date | Buyer | Sale Price | Title Company |
|---|---|---|---|
| Demullis Glenda R | $75,000 | -- |
Source: Public Records
Mortgage History
| Date | Status | Borrower | Loan Amount |
|---|---|---|---|
| Open | Demullis Glenda R | $85,000 | |
| Previous Owner | Demullis Glenda R | $35,000 |
Source: Public Records
Tax History Compared to Growth
Tax History
| Year | Tax Paid | Tax Assessment Tax Assessment Total Assessment is a certain percentage of the fair market value that is determined by local assessors to be the total taxable value of land and additions on the property. | Land | Improvement |
|---|---|---|---|---|
| 2025 | $4,869 | $405,100 | $248,500 | $156,600 |
| 2024 | $4,546 | $377,900 | $223,600 | $154,300 |
| 2023 | $4,676 | $367,600 | $223,600 | $144,000 |
| 2022 | $4,362 | $308,300 | $183,000 | $125,300 |
| 2021 | $4,119 | $282,500 | $174,500 | $108,000 |
| 2020 | $3,980 | $274,700 | $166,700 | $108,000 |
| 2019 | $3,800 | $260,300 | $162,500 | $97,800 |
| 2018 | $3,490 | $234,400 | $143,500 | $90,900 |
| 2017 | $3,423 | $226,700 | $135,800 | $90,900 |
| 2016 | $3,316 | $217,300 | $128,000 | $89,300 |
| 2015 | $2,756 | $187,000 | $116,300 | $70,700 |
Source: Public Records
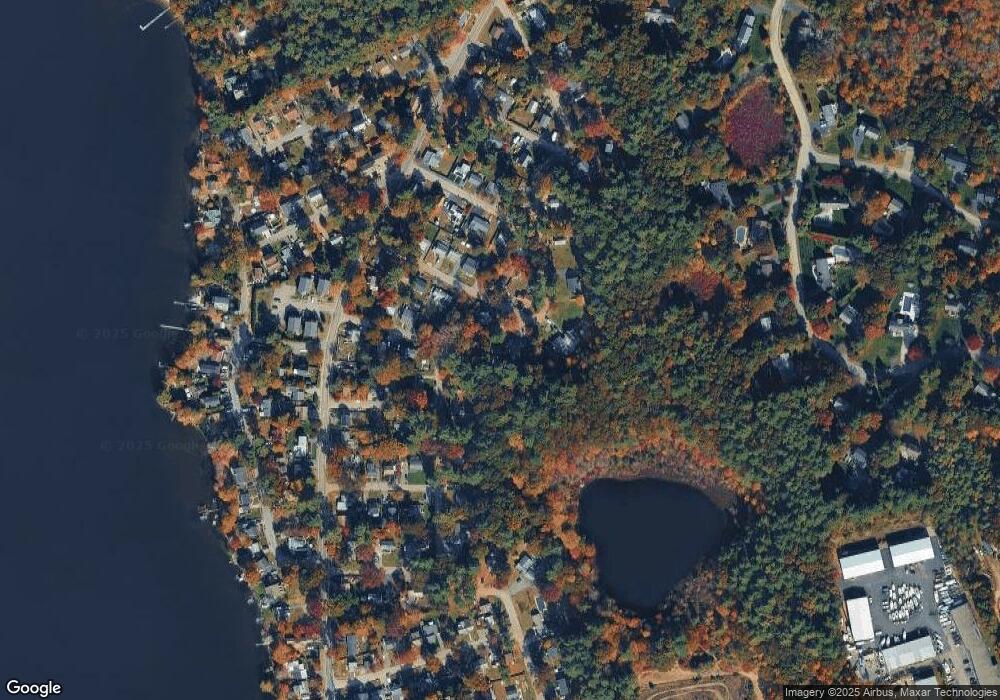
Map
Nearby Homes