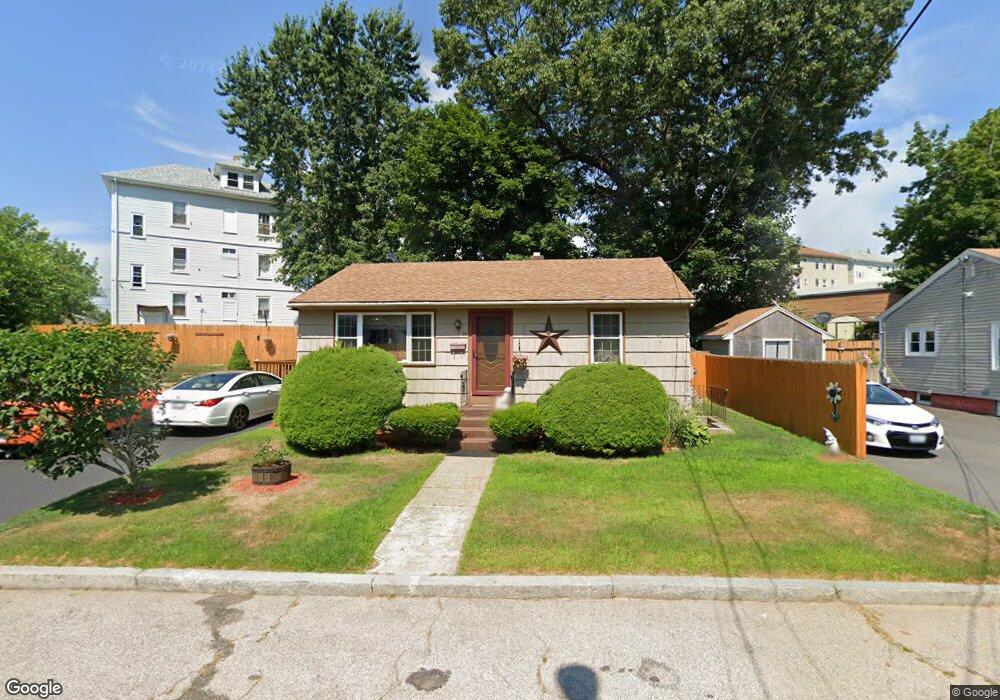
56 Jervis St Woonsocket, RI 02895
East Woonsocket NeighborhoodEstimated Value: $309,000 - $405,000
2
Beds
1
Bath
958
Sq Ft
$350/Sq Ft
Est. Value
About This Home
This home is located at 56 Jervis St, Woonsocket, RI 02895 and is currently estimated at $335,265, approximately $349 per square foot. 56 Jervis St is a home located in Providence County with nearby schools including Woonsocket High School, Rise Prep Mayoral Academy Middle School, and Good Shepherd Catholic School.
Ownership History
Date
Name
Owned For
Owner Type
Purchase Details
Closed on
Nov 30, 2004
Sold by
Carlisle Duane E and Carlisle Carol A
Bought by
Lanoue Joanne
Current Estimated Value
Home Financials for this Owner
Home Financials are based on the most recent Mortgage that was taken out on this home.
Original Mortgage
$133,950
Outstanding Balance
$66,250
Interest Rate
5.75%
Mortgage Type
Purchase Money Mortgage
Estimated Equity
$269,015
Create a Home Valuation Report for This Property
The Home Valuation Report is an in-depth analysis detailing your home's value as well as a comparison with similar homes in the area
Home Values in the Area
Average Home Value in this Area
Purchase History
| Date | Buyer | Sale Price | Title Company |
|---|---|---|---|
| Lanoue Joanne | $141,000 | -- | |
| Lanoue Joanne | $141,000 | -- |
Source: Public Records
Mortgage History
| Date | Status | Borrower | Loan Amount |
|---|---|---|---|
| Open | Lanoue Joanne | $133,950 | |
| Closed | Lanoue Joanne | $133,950 |
Source: Public Records
Tax History
| Year | Tax Paid | Tax Assessment Tax Assessment Total Assessment is a certain percentage of the fair market value that is determined by local assessors to be the total taxable value of land and additions on the property. | Land | Improvement |
|---|---|---|---|---|
| 2025 | $3,247 | $289,100 | $99,700 | $189,400 |
| 2024 | $3,000 | $206,300 | $88,400 | $117,900 |
| 2023 | $2,884 | $206,300 | $88,400 | $117,900 |
| 2022 | $2,884 | $206,300 | $88,400 | $117,900 |
| 2021 | $2,959 | $124,600 | $54,400 | $70,200 |
| 2020 | $2,990 | $124,600 | $54,400 | $70,200 |
| 2018 | $3,000 | $124,600 | $54,400 | $70,200 |
| 2017 | $3,058 | $101,600 | $43,500 | $58,100 |
| 2016 | $3,235 | $101,600 | $43,500 | $58,100 |
| 2015 | $3,717 | $101,600 | $43,500 | $58,100 |
| 2014 | $2,657 | $105,600 | $47,800 | $57,800 |
Source: Public Records
Map
Nearby Homes
- 23 Rutland St
- 568 Elm St
- 34 Heroux Ave
- 56 Mailloux St
- 311 Elm St
- 271 Elm St
- 263 Elm St
- 110 Saint Leon Ave
- 68 Kenwood St
- 95 Mitris Blvd
- 375 Congress St
- 142 Brook St
- 685 Social St Unit 308
- 685 Social St Unit 211
- 685 Social St Unit 115
- 212 Saint Louis Ave
- 188 Saint Louis Ave
- 178 Saint Louis Ave
- 752 Social St
- 18 Villa Nova St
Your Personal Tour Guide
Ask me questions while you tour the home.