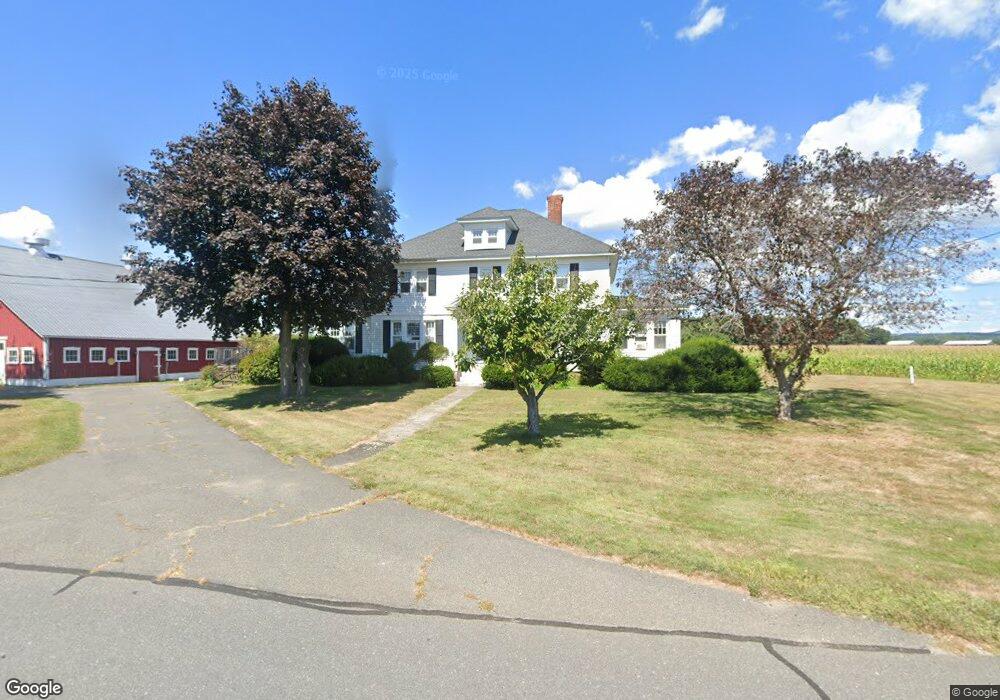
56 Knightly Rd Hadley, MA 01035
Estimated Value: $448,000 - $585,000
4
Beds
2
Baths
2,691
Sq Ft
$203/Sq Ft
Est. Value
About This Home
This home is located at 56 Knightly Rd, Hadley, MA 01035 and is currently estimated at $546,525, approximately $203 per square foot. 56 Knightly Rd is a home located in Hampshire County with nearby schools including Hadley Elementary School, Pioneer Valley Chinese Immersion Charter School, and The Common School.
Ownership History
Date
Name
Owned For
Owner Type
Purchase Details
Closed on
Aug 25, 2025
Sold by
Devine James E
Bought by
Devine 2025 T and Devine D
Current Estimated Value
Purchase Details
Closed on
Dec 13, 2024
Sold by
Cromack Patricia D and Devine Gerald T
Bought by
Devine Gerald T and Devine Daniel J
Purchase Details
Closed on
Aug 18, 2022
Sold by
Devine Thomas F
Bought by
Cromack Patricia A and Devine Gerald T
Purchase Details
Closed on
Jul 6, 2017
Sold by
Devine Susan E and Devine John F
Bought by
Devine Thomas F
Purchase Details
Closed on
Oct 2, 2006
Sold by
Devine John E and Devine Mary J
Bought by
Devine Robert E and Devine Stephen W
Create a Home Valuation Report for This Property
The Home Valuation Report is an in-depth analysis detailing your home's value as well as a comparison with similar homes in the area
Home Values in the Area
Average Home Value in this Area
Purchase History
| Date | Buyer | Sale Price | Title Company |
|---|---|---|---|
| Devine 2025 T | -- | -- | |
| Devine 2025 T | -- | -- | |
| Devine Gerald T | -- | None Available | |
| Devine Gerald T | -- | None Available | |
| Cromack Patricia A | -- | None Available | |
| Cromack Patricia A | -- | None Available | |
| Cromack Patricia A | -- | None Available | |
| Devine Thomas F | $385,000 | -- | |
| Devine Thomas F | $385,000 | -- | |
| Devine Robert E | $76,754 | -- | |
| Devine Thomas F | $385,000 | -- | |
| Devine Robert E | $76,754 | -- |
Source: Public Records
Tax History Compared to Growth
Tax History
| Year | Tax Paid | Tax Assessment Tax Assessment Total Assessment is a certain percentage of the fair market value that is determined by local assessors to be the total taxable value of land and additions on the property. | Land | Improvement |
|---|---|---|---|---|
| 2025 | $4,708 | $404,800 | $135,500 | $269,300 |
| 2024 | $4,538 | $398,400 | $135,500 | $262,900 |
| 2023 | $4,397 | $381,000 | $135,500 | $245,500 |
| 2022 | $4,084 | $335,300 | $135,500 | $199,800 |
| 2021 | $3,984 | $332,000 | $135,500 | $196,500 |
| 2020 | $4,091 | $320,100 | $135,500 | $184,600 |
| 2019 | $3,956 | $320,100 | $135,500 | $184,600 |
| 2018 | $3,870 | $320,100 | $135,500 | $184,600 |
| 2017 | $3,601 | $311,200 | $135,100 | $176,100 |
| 2016 | $3,470 | $311,200 | $135,100 | $176,100 |
| 2015 | $3,337 | $307,300 | $131,200 | $176,100 |
| 2014 | $3,270 | $307,300 | $131,200 | $176,100 |
Source: Public Records
Map
Nearby Homes
- 7 Roosevelt St
- 39 Valley Ln
- 88 Farview Way
- 11 Sheerman Ln
- 13 Harlow Dr
- 65 N Prospect St
- 185 Cherry Ln
- 18 N Prospect St
- 958 E Pleasant St
- 3 Depot Rd
- 15 S Plain Rd
- 136 Main St
- 110 Grantwood Dr
- 161 Chestnut St
- Lot A Kingman Rd
- 0 Red Gate Ln Unit 73348273
- 48 Gray St
- 0 Henry St
- 305 Strong St
- 58 Main St Unit 4
- 52 Knightly Rd
- 50 Knightly Rd
- 48 Knightly Rd
- 49 Knightly Rd
- 64 Knightly Rd
- 47 Knightly Rd
- 57 Knightly Rd
- 40 Knightly Rd
- 45 Knightly Rd
- 43 Knightly Rd
- 36 Knightly Rd
- 74 Knightly Rd
- 32 Knightly Rd
- 39 Roosevelt St
- 28 Knightly Rd
- 20 Knightly Rd
- 19 Roosevelt St
- 25 Roosevelt St
- 39 Knightly Rd
- 35 Roosevelt St