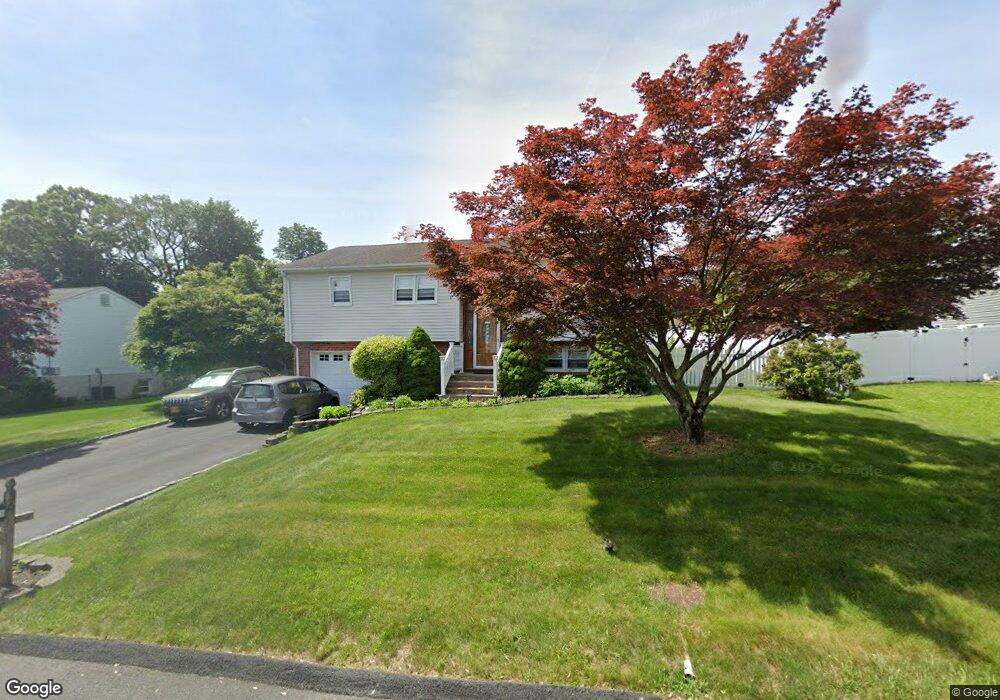
56 Maple Dr Stony Point, NY 10980
Estimated Value: $623,000 - $678,000
3
Beds
2
Baths
1,257
Sq Ft
$512/Sq Ft
Est. Value
About This Home
This home is located at 56 Maple Dr, Stony Point, NY 10980 and is currently estimated at $643,573, approximately $511 per square foot. 56 Maple Dr is a home located in Rockland County with nearby schools including James A. Farley Middle School, Stony Point Elementary School, and Fieldstone Secondary School.
Ownership History
Date
Name
Owned For
Owner Type
Purchase Details
Closed on
Apr 24, 2019
Sold by
Matera Michael and Matera Kim Marie
Bought by
Matera Michael and Matera Kim Marie
Current Estimated Value
Home Financials for this Owner
Home Financials are based on the most recent Mortgage that was taken out on this home.
Original Mortgage
$33,376
Interest Rate
4.2%
Mortgage Type
New Conventional
Create a Home Valuation Report for This Property
The Home Valuation Report is an in-depth analysis detailing your home's value as well as a comparison with similar homes in the area
Home Values in the Area
Average Home Value in this Area
Purchase History
| Date | Buyer | Sale Price | Title Company |
|---|---|---|---|
| Matera Michael | -- | None Available |
Source: Public Records
Mortgage History
| Date | Status | Borrower | Loan Amount |
|---|---|---|---|
| Closed | Matera Michael | $33,376 |
Source: Public Records
Tax History
| Year | Tax Paid | Tax Assessment Tax Assessment Total Assessment is a certain percentage of the fair market value that is determined by local assessors to be the total taxable value of land and additions on the property. | Land | Improvement |
|---|---|---|---|---|
| 2022 | $3,694 | $40,200 | $8,400 | $31,800 |
| 2021 | $3,694 | $40,200 | $8,400 | $31,800 |
| 2020 | $9,557 | $40,200 | $8,400 | $31,800 |
| 2019 | $3,121 | $40,200 | $8,400 | $31,800 |
| 2018 | $9,159 | $40,200 | $8,400 | $31,800 |
| 2017 | $8,992 | $40,200 | $8,400 | $31,800 |
| 2016 | $9,289 | $40,200 | $8,400 | $31,800 |
| 2015 | -- | $40,200 | $8,400 | $31,800 |
| 2014 | -- | $40,200 | $8,400 | $31,800 |
Source: Public Records
Map
Nearby Homes
- 178 Washburns Ln
- 161 Washburns Ln
- 3 N Mountain View
- 33 de Halve Maen Dr
- 15 Pine Dr
- 121 Thiells Rd
- 23 Sunrise Dr
- 6 Phillips Dr
- 8 Autumn Ln
- 15 Dickens St
- 18 Lake Rd
- 57 Mountain View Mobile Home Park
- 7 Southpark Dr
- 50 Major Andre Dr
- 10 Roman Acres Dr
- 21 Janet Place
- 11 Centennial Dr
- 17 John F. Kennedy Dr
- 30 Govan Dr
- 15 Wenzel Ln
Your Personal Tour Guide
Ask me questions while you tour the home.