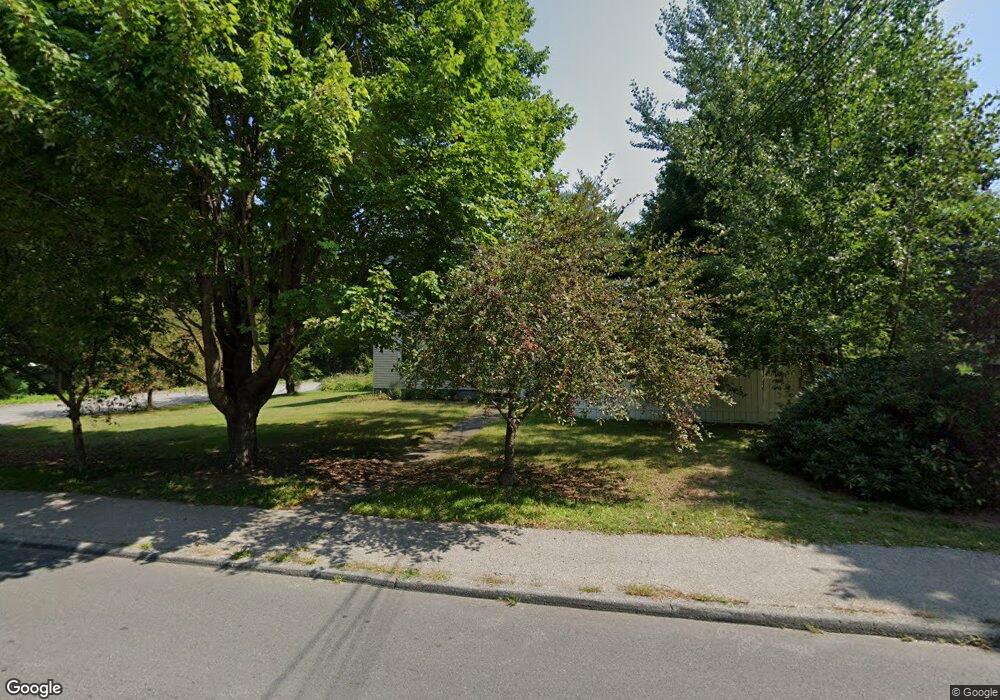
56 Maple St Bellingham, MA 02019
Estimated Value: $403,800 - $498,000
3
Beds
1
Bath
1,348
Sq Ft
$335/Sq Ft
Est. Value
About This Home
This home is located at 56 Maple St, Bellingham, MA 02019 and is currently estimated at $451,450, approximately $334 per square foot. 56 Maple St is a home located in Norfolk County with nearby schools including Stall Brook Elementary School, Bellingham High School, and Bethany Christian Academy.
Ownership History
Date
Name
Owned For
Owner Type
Purchase Details
Closed on
Dec 3, 1996
Sold by
Nadolny Ex Stephen and Nadolny Ex Walter F
Bought by
Corbiere Ethan P
Current Estimated Value
Home Financials for this Owner
Home Financials are based on the most recent Mortgage that was taken out on this home.
Original Mortgage
$97,648
Outstanding Balance
$10,033
Interest Rate
7.82%
Mortgage Type
Purchase Money Mortgage
Estimated Equity
$441,417
Create a Home Valuation Report for This Property
The Home Valuation Report is an in-depth analysis detailing your home's value as well as a comparison with similar homes in the area
Home Values in the Area
Average Home Value in this Area
Purchase History
| Date | Buyer | Sale Price | Title Company |
|---|---|---|---|
| Corbiere Ethan P | $100,000 | -- | |
| Corbiere Ethan P | $100,000 | -- |
Source: Public Records
Mortgage History
| Date | Status | Borrower | Loan Amount |
|---|---|---|---|
| Open | Corbiere Ethan P | $40,000 | |
| Open | Corbiere Ethan P | $97,648 | |
| Closed | Corbiere Ethan P | $97,648 |
Source: Public Records
Tax History
| Year | Tax Paid | Tax Assessment Tax Assessment Total Assessment is a certain percentage of the fair market value that is determined by local assessors to be the total taxable value of land and additions on the property. | Land | Improvement |
|---|---|---|---|---|
| 2025 | $3,995 | $318,100 | $130,700 | $187,400 |
| 2024 | $3,830 | $297,800 | $119,400 | $178,400 |
| 2023 | $3,693 | $283,000 | $113,700 | $169,300 |
| 2022 | $3,592 | $255,100 | $94,800 | $160,300 |
| 2021 | $3,476 | $241,200 | $94,800 | $146,400 |
| 2020 | $3,329 | $234,100 | $94,800 | $139,300 |
| 2019 | $3,256 | $229,100 | $94,800 | $134,300 |
| 2018 | $3,091 | $214,500 | $95,600 | $118,900 |
| 2017 | $3,026 | $211,000 | $95,600 | $115,400 |
| 2016 | $2,918 | $204,200 | $99,500 | $104,700 |
| 2015 | $2,800 | $196,500 | $95,600 | $100,900 |
| 2014 | $2,794 | $190,600 | $92,300 | $98,300 |
Source: Public Records
Map
Nearby Homes
Your Personal Tour Guide
Ask me questions while you tour the home.