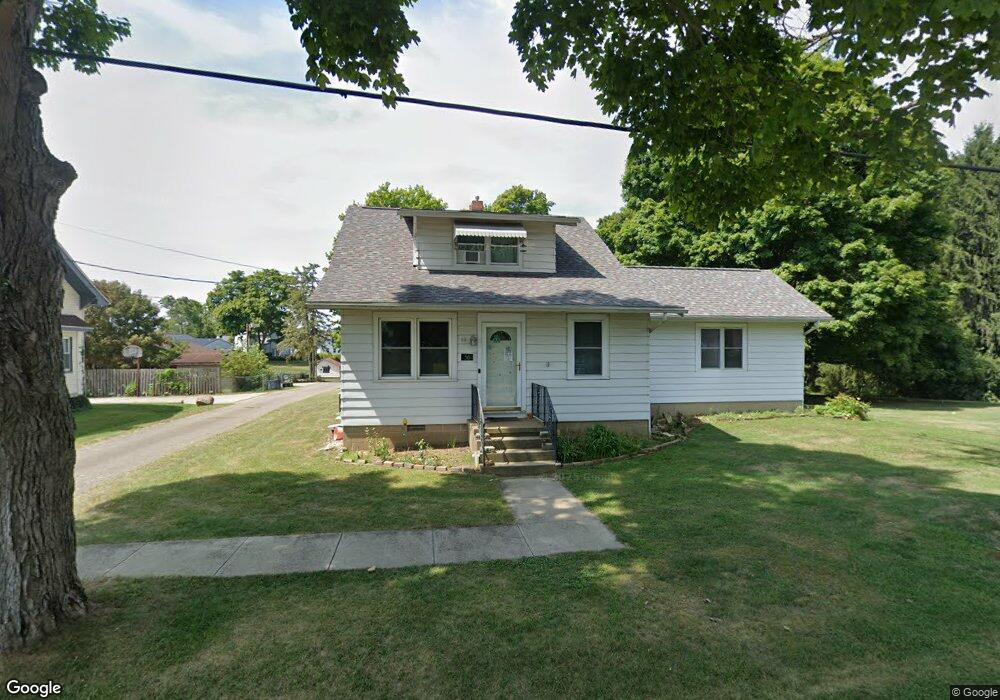
56 N Beaver St Carroll, OH 43112
Estimated Value: $373,842 - $451,000
3
Beds
3
Baths
1,556
Sq Ft
$257/Sq Ft
Est. Value
About This Home
This home is located at 56 N Beaver St, Carroll, OH 43112 and is currently estimated at $399,461, approximately $256 per square foot. 56 N Beaver St is a home located in Fairfield County with nearby schools including Bloom Carroll Primary School, Bloom Carroll Intermediate School, and Bloom-Carroll Middle School.
Ownership History
Date
Name
Owned For
Owner Type
Purchase Details
Closed on
Apr 28, 2014
Sold by
Exline Charlotte A
Bought by
Jensen Jon and Jensen Tiffany
Current Estimated Value
Home Financials for this Owner
Home Financials are based on the most recent Mortgage that was taken out on this home.
Original Mortgage
$161,500
Outstanding Balance
$123,449
Interest Rate
4.41%
Mortgage Type
VA
Estimated Equity
$276,012
Purchase Details
Closed on
Aug 29, 2007
Sold by
Kettell Todd C and Kettell Valerie L
Bought by
Exline Charlotte A
Home Financials for this Owner
Home Financials are based on the most recent Mortgage that was taken out on this home.
Original Mortgage
$167,427
Interest Rate
6.79%
Mortgage Type
VA
Purchase Details
Closed on
Oct 23, 1992
Bought by
Park National Bank Trustee
Create a Home Valuation Report for This Property
The Home Valuation Report is an in-depth analysis detailing your home's value as well as a comparison with similar homes in the area
Home Values in the Area
Average Home Value in this Area
Purchase History
| Date | Buyer | Sale Price | Title Company |
|---|---|---|---|
| Jensen Jon | $161,500 | Attorney | |
| Exline Charlotte A | $160,000 | Valmer Land Title Agency | |
| Park National Bank Trustee | $90,000 | -- | |
| Park National Bank Trustee | -- | -- |
Source: Public Records
Mortgage History
| Date | Status | Borrower | Loan Amount |
|---|---|---|---|
| Open | Jensen Jon | $161,500 | |
| Previous Owner | Exline Charlotte A | $167,427 |
Source: Public Records
Tax History Compared to Growth
Tax History
| Year | Tax Paid | Tax Assessment Tax Assessment Total Assessment is a certain percentage of the fair market value that is determined by local assessors to be the total taxable value of land and additions on the property. | Land | Improvement |
|---|---|---|---|---|
| 2024 | $8,182 | $102,660 | $33,860 | $68,800 |
| 2023 | $4,443 | $102,660 | $33,860 | $68,800 |
| 2022 | $4,476 | $102,660 | $33,860 | $68,800 |
| 2021 | $3,214 | $72,450 | $28,220 | $44,230 |
| 2020 | $3,253 | $72,450 | $28,220 | $44,230 |
| 2019 | $3,266 | $72,450 | $28,220 | $44,230 |
| 2018 | $2,201 | $41,180 | $9,880 | $31,300 |
| 2017 | $2,063 | $50,240 | $9,880 | $40,360 |
| 2016 | $2,000 | $50,240 | $9,880 | $40,360 |
| 2015 | $1,843 | $45,100 | $9,880 | $35,220 |
| 2014 | $1,760 | $45,100 | $9,880 | $35,220 |
| 2013 | $1,760 | $45,100 | $9,880 | $35,220 |
Source: Public Records
Map
Nearby Homes
- 52 W Canal St
- 62 Oberle Ave
- 5341 Carnes Rd
- 2155 Carroll-Southern Rd NW
- 4656 Meadow Grove Dr NW
- 6920 Winchester Rd NW
- 4180 Stone Hill Drive East NW
- 3738 Arrowhead Dr NW
- 4900 Pickerington Rd NW
- 5726 Bish Rd
- 2831 Sterling Dr NW
- 0 Pleasantville Rd NW Unit Lot 7
- 8322 Benson Rd
- 1975 Lamb Rd NW
- 7936 Allen Rd
- 5560 Amanda Northern Rd NW
- 7985 Lithopolis Rd NW
- 7234 Pickerington Rd
- 4077 Basil Western Rd NW
- 4129 Brook Rd NW