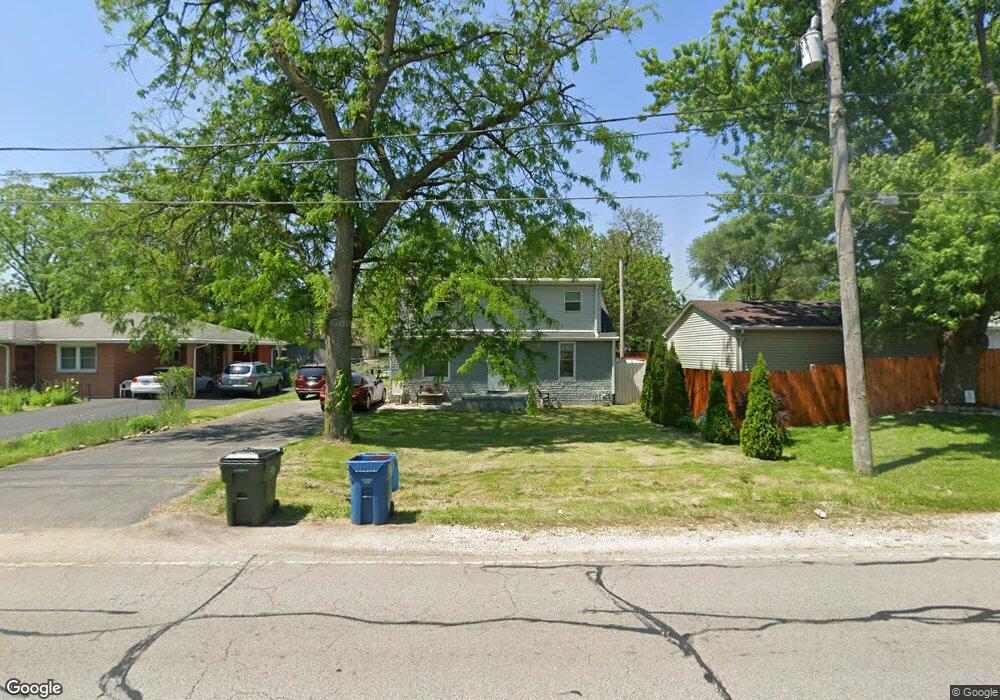
56 N Farnsworth Ave Aurora, IL 60505
Light of the Community NeighborhoodEstimated Value: $196,000 - $269,000
5
Beds
3
Baths
1,200
Sq Ft
$194/Sq Ft
Est. Value
About This Home
This home is located at 56 N Farnsworth Ave, Aurora, IL 60505 and is currently estimated at $232,397, approximately $193 per square foot. 56 N Farnsworth Ave is a home located in Kane County with nearby schools including O.C. Allen Elementary School, Henry W Cowherd Middle School, and East Aurora High School.
Ownership History
Date
Name
Owned For
Owner Type
Purchase Details
Closed on
Jul 2, 2012
Sold by
Villa Lazaro
Bought by
Acosta Marquez Maria S
Current Estimated Value
Home Financials for this Owner
Home Financials are based on the most recent Mortgage that was taken out on this home.
Original Mortgage
$66,768
Outstanding Balance
$48,375
Interest Rate
4.75%
Mortgage Type
FHA
Estimated Equity
$184,022
Purchase Details
Closed on
Jan 4, 2010
Sold by
Deutsche Bank National Trust Company
Bought by
Villa Lazaro
Purchase Details
Closed on
Oct 5, 2009
Sold by
Gallardo Victor
Bought by
Deutsche Bank National Trust Company
Purchase Details
Closed on
Jul 23, 2004
Sold by
Foxhollow Trust and Long Donald
Bought by
Gallardo Victor
Home Financials for this Owner
Home Financials are based on the most recent Mortgage that was taken out on this home.
Original Mortgage
$70,000
Interest Rate
6.1%
Mortgage Type
Purchase Money Mortgage
Create a Home Valuation Report for This Property
The Home Valuation Report is an in-depth analysis detailing your home's value as well as a comparison with similar homes in the area
Home Values in the Area
Average Home Value in this Area
Purchase History
| Date | Buyer | Sale Price | Title Company |
|---|---|---|---|
| Acosta Marquez Maria S | $68,000 | Chicago Title Insurance Comp | |
| Villa Lazaro | $37,000 | Premier Title Company | |
| Deutsche Bank National Trust Company | -- | Premier Title | |
| Gallardo Victor | $70,000 | Multiple |
Source: Public Records
Mortgage History
| Date | Status | Borrower | Loan Amount |
|---|---|---|---|
| Open | Acosta Marquez Maria S | $66,768 | |
| Previous Owner | Gallardo Victor | $70,000 |
Source: Public Records
Tax History Compared to Growth
Tax History
| Year | Tax Paid | Tax Assessment Tax Assessment Total Assessment is a certain percentage of the fair market value that is determined by local assessors to be the total taxable value of land and additions on the property. | Land | Improvement |
|---|---|---|---|---|
| 2024 | $3,189 | $54,518 | $4,077 | $50,441 |
| 2023 | $3,042 | $48,712 | $3,643 | $45,069 |
| 2022 | $2,921 | $44,445 | $3,324 | $41,121 |
| 2021 | $2,856 | $41,379 | $3,095 | $38,284 |
| 2020 | $2,697 | $38,435 | $2,875 | $35,560 |
| 2019 | $2,609 | $35,611 | $2,664 | $32,947 |
| 2018 | $2,416 | $32,532 | $2,464 | $30,068 |
| 2017 | $1,747 | $23,817 | $2,270 | $21,547 |
| 2016 | $1,721 | $22,350 | $1,946 | $20,404 |
| 2015 | -- | $19,760 | $1,673 | $18,087 |
| 2014 | -- | $14,374 | $1,538 | $12,836 |
| 2013 | -- | $15,606 | $1,547 | $14,059 |
Source: Public Records
Map
Nearby Homes
- 131 N Kendall St
- 1311 Kane St
- 15 Hill Ave
- 257 Vermont Ave
- 409 Dayward Ct
- 610 Four Seasons Blvd Unit A071
- 1653 Victoria Park Cir Unit A183
- 226 N Ohio St
- 1038 Liberty St
- 1825 Bluestem Cir
- 675 Serendipity Dr Unit 9182
- 1811 Bluestem Cir
- 172 N East Ave
- 734 Four Seasons Blvd Unit 9098
- 1601 Simms St Unit 6386
- 799 Symphony Dr Unit 8084
- 863 Symphony Dr Unit 7151
- 1853 Westridge Place
- 1900 E New York St
- 859 Symphony Dr Unit 7153
- 52 N Farnsworth Ave
- 1341 Grand Blvd
- 1339 Grand Blvd
- 1345 Grand Blvd
- 1337 Grand Blvd
- 43 N Calhoun St
- 1327 Grand Blvd
- 38 N Farnsworth Ave
- 33 N Calhoun St
- 31 N Calhoun St
- 34 N Farnsworth Ave
- 1338 Grand Blvd
- 29 N Calhoun St
- 101 N Farnsworth Ave
- 106 N Farnsworth Ave
- 30 N Farnsworth Ave
- 103 N Calhoun St
- 52 N Calhoun St
- 103 N Farnsworth Ave
- 1313 Grand Blvd