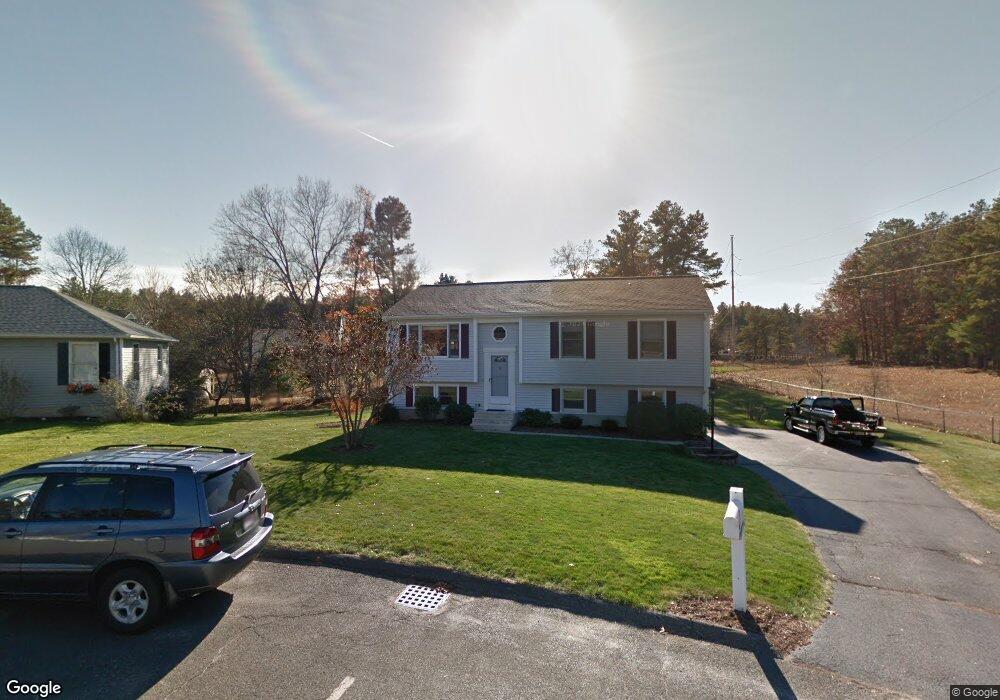
56 Overlook Dr Easthampton, MA 01027
Estimated Value: $493,000 - $576,000
3
Beds
3
Baths
1,638
Sq Ft
$324/Sq Ft
Est. Value
About This Home
This home is located at 56 Overlook Dr, Easthampton, MA 01027 and is currently estimated at $530,209, approximately $323 per square foot. 56 Overlook Dr is a home located in Hampshire County with nearby schools including Easthampton High School, Calvary Baptist Christian School, and Tri-County Schools.
Ownership History
Date
Name
Owned For
Owner Type
Purchase Details
Closed on
Jul 26, 2004
Sold by
Santaniello Luigi R
Bought by
Santaniello Christine M
Current Estimated Value
Purchase Details
Closed on
Dec 31, 1990
Sold by
Boyle Thomas J
Bought by
Santaniello Luigi
Create a Home Valuation Report for This Property
The Home Valuation Report is an in-depth analysis detailing your home's value as well as a comparison with similar homes in the area
Home Values in the Area
Average Home Value in this Area
Purchase History
| Date | Buyer | Sale Price | Title Company |
|---|---|---|---|
| Santaniello Christine M | -- | -- | |
| Santaniello Luigi | $114,000 | -- |
Source: Public Records
Mortgage History
| Date | Status | Borrower | Loan Amount |
|---|---|---|---|
| Previous Owner | Santaniello Luigi | $110,000 | |
| Previous Owner | Santaniello Luigi | $100,000 | |
| Previous Owner | Santaniello Luigi | $50,000 | |
| Previous Owner | Santaniello Luigi | $90,000 |
Source: Public Records
Tax History Compared to Growth
Tax History
| Year | Tax Paid | Tax Assessment Tax Assessment Total Assessment is a certain percentage of the fair market value that is determined by local assessors to be the total taxable value of land and additions on the property. | Land | Improvement |
|---|---|---|---|---|
| 2025 | $5,843 | $427,400 | $121,300 | $306,100 |
| 2024 | $5,627 | $415,000 | $118,000 | $297,000 |
| 2023 | $4,221 | $288,100 | $93,200 | $194,900 |
| 2022 | $4,762 | $288,100 | $93,200 | $194,900 |
| 2021 | $5,236 | $298,500 | $93,200 | $205,300 |
| 2020 | $5,117 | $288,100 | $93,200 | $194,900 |
| 2019 | $4,355 | $281,700 | $93,200 | $188,500 |
| 2018 | $4,166 | $260,400 | $87,800 | $172,600 |
| 2017 | $4,069 | $251,000 | $84,300 | $166,700 |
| 2016 | $4,063 | $260,600 | $84,300 | $176,300 |
| 2015 | $3,948 | $260,600 | $84,300 | $176,300 |
Source: Public Records
Map
Nearby Homes