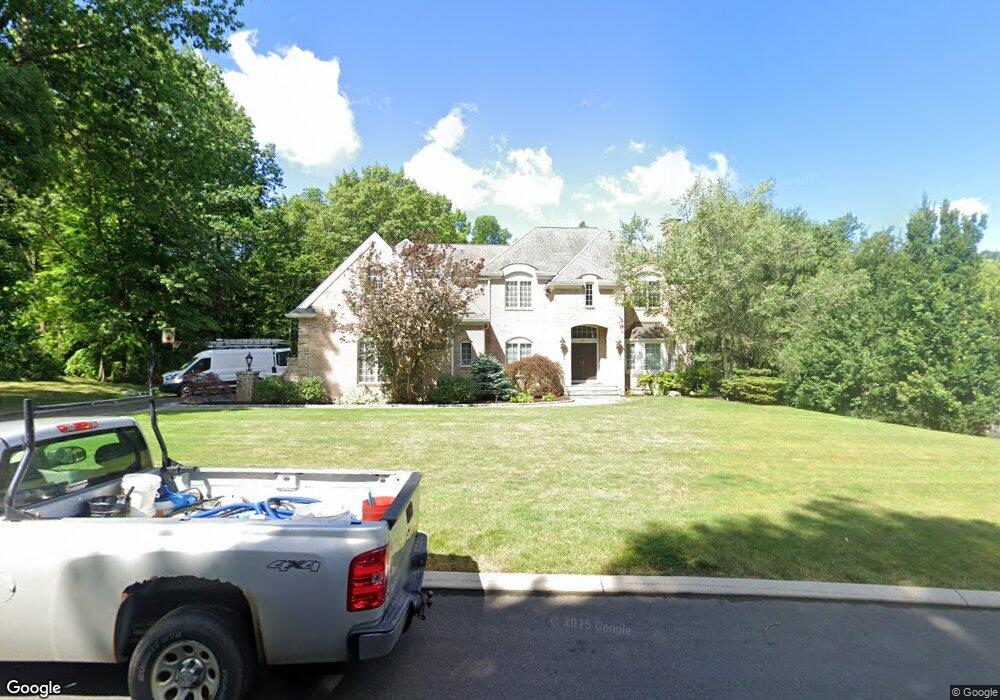
56 Pheasant Chase West Hartford, CT 06117
Estimated Value: $1,508,000 - $1,550,000
6
Beds
6
Baths
4,327
Sq Ft
$354/Sq Ft
Est. Value
About This Home
This home is located at 56 Pheasant Chase, West Hartford, CT 06117 and is currently estimated at $1,529,876, approximately $353 per square foot. 56 Pheasant Chase is a home located in Hartford County with nearby schools including Norfeldt School, King Philip Middle School, and Hall High School.
Ownership History
Date
Name
Owned For
Owner Type
Purchase Details
Closed on
Nov 19, 2009
Sold by
Moore Yan and Moore Revital
Bought by
Tenser Suzanne M and Chaletsky David M
Current Estimated Value
Home Financials for this Owner
Home Financials are based on the most recent Mortgage that was taken out on this home.
Original Mortgage
$685,000
Interest Rate
4.86%
Purchase Details
Closed on
Jan 10, 2008
Sold by
Willis Mark W and Willis Charlene A
Bought by
Cartus Financial Corp
Home Financials for this Owner
Home Financials are based on the most recent Mortgage that was taken out on this home.
Original Mortgage
$283,000
Interest Rate
6.21%
Purchase Details
Closed on
Aug 27, 1998
Sold by
Russo Deborah S
Bought by
Willis Mark W
Purchase Details
Closed on
Sep 16, 1991
Sold by
Weinberg Marjorie
Bought by
Goralnick Roseann
Create a Home Valuation Report for This Property
The Home Valuation Report is an in-depth analysis detailing your home's value as well as a comparison with similar homes in the area
Home Values in the Area
Average Home Value in this Area
Purchase History
| Date | Buyer | Sale Price | Title Company |
|---|---|---|---|
| Tenser Suzanne M | $860,000 | -- | |
| Cartus Financial Corp | $880,000 | -- | |
| Willis Mark W | $680,000 | -- | |
| Goralnick Roseann | $245,000 | -- |
Source: Public Records
Mortgage History
| Date | Status | Borrower | Loan Amount |
|---|---|---|---|
| Open | Goralnick Roseann | $676,000 | |
| Closed | Goralnick Roseann | $685,000 | |
| Previous Owner | Goralnick Roseann | $283,000 |
Source: Public Records
Tax History Compared to Growth
Tax History
| Year | Tax Paid | Tax Assessment Tax Assessment Total Assessment is a certain percentage of the fair market value that is determined by local assessors to be the total taxable value of land and additions on the property. | Land | Improvement |
|---|---|---|---|---|
| 2025 | $29,557 | $660,060 | $140,800 | $519,260 |
| 2024 | $26,468 | $624,990 | $140,800 | $484,190 |
| 2023 | $25,575 | $624,990 | $140,800 | $484,190 |
| 2022 | $25,425 | $624,990 | $140,800 | $484,190 |
| 2021 | $23,434 | $552,420 | $134,100 | $418,320 |
| 2020 | $23,455 | $561,120 | $131,700 | $429,420 |
| 2019 | $23,455 | $561,120 | $131,670 | $429,450 |
| 2018 | $23,006 | $561,120 | $131,670 | $429,450 |
| 2017 | $23,031 | $561,190 | $131,670 | $429,520 |
| 2016 | $24,037 | $608,370 | $122,010 | $486,360 |
| 2015 | $23,307 | $608,370 | $122,010 | $486,360 |
| 2014 | $22,735 | $608,370 | $122,010 | $486,360 |
Source: Public Records
Map
Nearby Homes
- 25 Lakeview Dr
- 1 Cedar Close
- 34 Cary Ln Unit 34
- 30 Biltmore Park Unit 30
- 75 Arlen Way
- 17 Cranbrook
- 40 Ferncliff Dr
- 10 Ironwood Ln
- 36 Richmond Ln
- 10 Hosmer Dr
- 15 Parsons Way
- 21 Barksdale Rd
- 365 Simsbury Rd
- 592 Mountain Rd Unit A
- 11 Rye Ridge Pkwy
- 16 Thistle Hollow
- 124 High Ridge Rd
- 5 Thistle Hollow
- 50 Magnolia Hill
- 7 Kirbyshire
- 52 Pheasant Chase
- 62 Pheasant Chase
- 57 Pheasant Chase
- 48 Pheasant Chase
- 49 Pheasant Chase
- 66 Pheasant Chase
- 65 Pheasant Chase
- 44 Pheasant Chase
- 41 Pheasant Chase
- 11 Fawn Brook
- 7 Fawn Brook
- 40 Pheasant Chase
- 38 Pheasant Chase
- 29 Pheasant Chase
- 17 Fawn Brook
- 36 Pheasant Chase
- 3 Fawn Brook
- 21 Fawn Brook
- 25 Fawn Brook
- 12 Fawn Brook