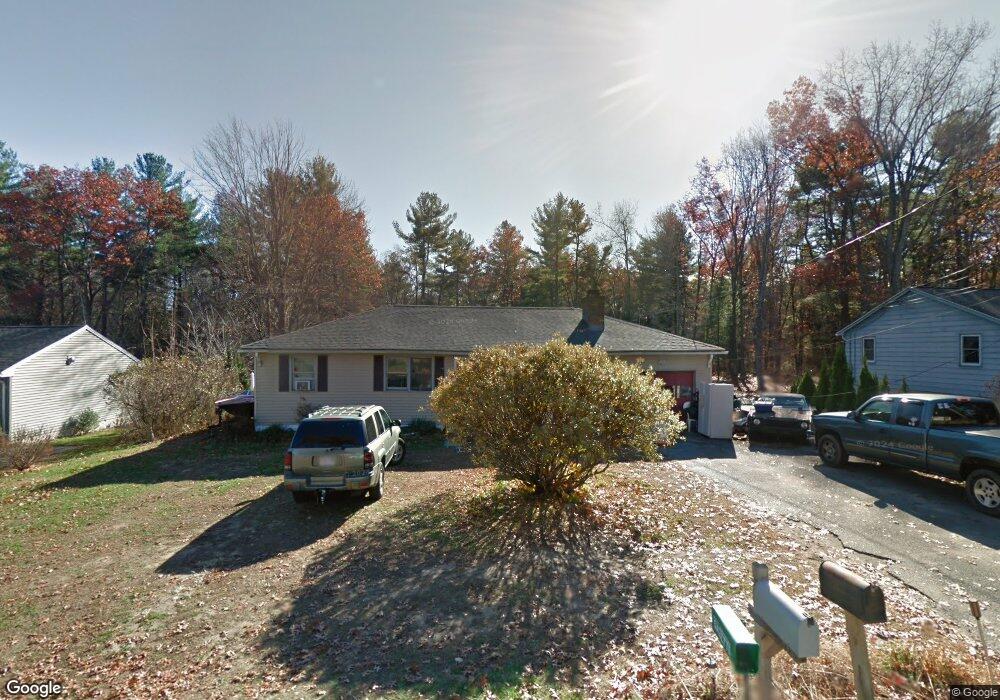
56 Plain St Easthampton, MA 01027
Estimated Value: $341,000 - $389,000
3
Beds
2
Baths
1,107
Sq Ft
$328/Sq Ft
Est. Value
About This Home
This home is located at 56 Plain St, Easthampton, MA 01027 and is currently estimated at $362,842, approximately $327 per square foot. 56 Plain St is a home located in Hampshire County with nearby schools including Easthampton High School, Calvary Baptist Christian School, and Tri-County Schools.
Ownership History
Date
Name
Owned For
Owner Type
Purchase Details
Closed on
Jul 6, 1993
Sold by
Michonski Ronald M and Michonski Marlene J
Bought by
Ison Guy R and Ison Donna A
Current Estimated Value
Home Financials for this Owner
Home Financials are based on the most recent Mortgage that was taken out on this home.
Original Mortgage
$84,700
Interest Rate
7.46%
Mortgage Type
Purchase Money Mortgage
Create a Home Valuation Report for This Property
The Home Valuation Report is an in-depth analysis detailing your home's value as well as a comparison with similar homes in the area
Home Values in the Area
Average Home Value in this Area
Purchase History
| Date | Buyer | Sale Price | Title Company |
|---|---|---|---|
| Ison Guy R | $105,900 | -- |
Source: Public Records
Mortgage History
| Date | Status | Borrower | Loan Amount |
|---|---|---|---|
| Closed | Ison Guy R | $84,700 | |
| Previous Owner | Ison Guy R | $92,000 |
Source: Public Records
Tax History
| Year | Tax Paid | Tax Assessment Tax Assessment Total Assessment is a certain percentage of the fair market value that is determined by local assessors to be the total taxable value of land and additions on the property. | Land | Improvement |
|---|---|---|---|---|
| 2025 | $4,339 | $317,400 | $109,400 | $208,000 |
| 2024 | $4,193 | $309,200 | $106,300 | $202,900 |
| 2023 | $3,226 | $220,200 | $83,500 | $136,700 |
| 2022 | $3,640 | $220,200 | $83,500 | $136,700 |
| 2021 | $3,975 | $226,600 | $83,500 | $143,100 |
| 2020 | $3,911 | $220,200 | $83,500 | $136,700 |
| 2019 | $3,287 | $212,600 | $83,500 | $129,100 |
| 2018 | $3,163 | $197,700 | $78,800 | $118,900 |
| 2017 | $3,094 | $190,900 | $75,800 | $115,100 |
| 2016 | $3,212 | $206,000 | $75,800 | $130,200 |
| 2015 | $3,121 | $206,000 | $75,800 | $130,200 |
Source: Public Records
Map
Nearby Homes
Your Personal Tour Guide
Ask me questions while you tour the home.