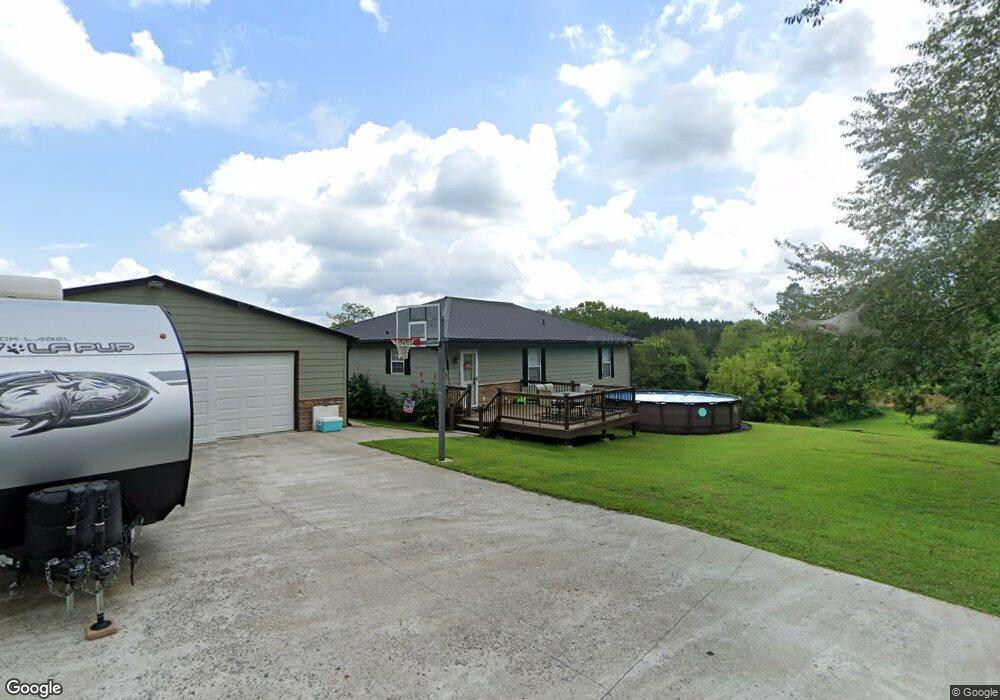
56 Red Branch Rd Talking Rock, GA 30175
Estimated Value: $241,000 - $338,000
Studio
2
Baths
1,380
Sq Ft
$213/Sq Ft
Est. Value
About This Home
This home is located at 56 Red Branch Rd, Talking Rock, GA 30175 and is currently estimated at $293,577, approximately $212 per square foot. 56 Red Branch Rd is a home located in Pickens County with nearby schools including Hill City Elementary School, Pickens County Middle School, and Pickens County High School.
Ownership History
Date
Name
Owned For
Owner Type
Purchase Details
Closed on
Jan 15, 2016
Sold by
Mcgraw Michael H
Bought by
Mcgraw Michael H and Mcgraw Cortney A
Current Estimated Value
Home Financials for this Owner
Home Financials are based on the most recent Mortgage that was taken out on this home.
Original Mortgage
$118,400
Outstanding Balance
$70,837
Interest Rate
3.99%
Mortgage Type
New Conventional
Estimated Equity
$222,740
Purchase Details
Closed on
Dec 28, 2004
Sold by
Colter Deborah A
Bought by
Mcgraw Michael H
Home Financials for this Owner
Home Financials are based on the most recent Mortgage that was taken out on this home.
Original Mortgage
$134,200
Interest Rate
5.71%
Mortgage Type
New Conventional
Purchase Details
Closed on
Oct 10, 2003
Sold by
Slater Tonya
Bought by
Colter Deborah A
Purchase Details
Closed on
Aug 7, 2003
Sold by
Citibank N A As Trustee
Bought by
Slater Tonya
Purchase Details
Closed on
Feb 4, 2003
Sold by
Thomas Howard and Thomas Lesl
Bought by
Citibank N A As Trustee
Purchase Details
Closed on
Feb 24, 1999
Bought by
Thomas Howard and Thomas Lesl
Create a Home Valuation Report for This Property
The Home Valuation Report is an in-depth analysis detailing your home's value as well as a comparison with similar homes in the area
Home Values in the Area
Average Home Value in this Area
Purchase History
| Date | Buyer | Sale Price | Title Company |
|---|---|---|---|
| Mcgraw Michael H | -- | -- | |
| Mcgraw Michael H | $129,000 | -- | |
| Mcgraw Michael H | $129,000 | -- | |
| Colter Deborah A | $126,400 | -- | |
| Slater Tonya | $79,000 | -- | |
| Citibank N A As Trustee | -- | -- | |
| Thomas Howard | $3,000 | -- |
Source: Public Records
Mortgage History
| Date | Status | Borrower | Loan Amount |
|---|---|---|---|
| Open | Mcgraw Michael H | $118,400 | |
| Previous Owner | Mcgraw Michael H | $134,200 |
Source: Public Records
Tax History
| Year | Tax Paid | Tax Assessment Tax Assessment Total Assessment is a certain percentage of the fair market value that is determined by local assessors to be the total taxable value of land and additions on the property. | Land | Improvement |
|---|---|---|---|---|
| 2025 | $1,344 | $136,307 | $24,254 | $112,053 |
| 2024 | $1,316 | $71,510 | $11,038 | $60,472 |
| 2023 | $1,353 | $71,510 | $11,038 | $60,472 |
| 2022 | $1,353 | $71,510 | $11,038 | $60,472 |
| 2021 | $1,449 | $71,510 | $11,038 | $60,472 |
| 2020 | $1,027 | $50,749 | $11,038 | $39,711 |
| 2019 | $1,050 | $50,749 | $11,038 | $39,711 |
| 2018 | $1,060 | $50,749 | $11,038 | $39,711 |
| 2017 | $1,078 | $50,749 | $11,038 | $39,711 |
| 2016 | $1,085 | $50,324 | $10,614 | $39,711 |
| 2015 | $1,059 | $50,324 | $10,614 | $39,711 |
| 2014 | $1,062 | $50,324 | $10,614 | $39,711 |
| 2013 | -- | $50,324 | $10,613 | $39,710 |
Source: Public Records
Map
Nearby Homes
- 711 Carver Mill Rd
- 0 Carver Mill Rd Unit 7670227
- 0 Carver Mill Rd Unit 7670211
- 11 Bradley Rd
- 10746 Highway 53 W
- 121 Haley Mountain Rd
- 0 Pin Hook Rd Unit 7616347
- 200 Willow Ln
- 0 Black Knob Church Rd - Tract 3
- Lot 1 Thompson Ln
- 0 Black Knob Church Rd Unit TRACT 3
- 629 Georgia 136 Connector
- 000 Black Knob Church Rd
- 3199 Big Ridge Rd
- 110 Jerusalem Farms Dr
- 0 Bryant Rd Unit 7713526
- 0 Bryant Rd Unit 10684467
- 126 Jerusalem Farms Dr
- 1703 Bryant Rd
- 0 Swan Bridge Rd Unit 7701634
- 73 Red Branch Rd
- 650 Carver Mill Rd
- 84 Red Branch Rd
- 606 Carver Mill Rd
- 365 Red Branch Rd
- 806 Carver Mill Rd
- 849 Dean Mill Rd
- 684 Dean Mill Rd
- 682 Dean Mill Rd
- 579 Carver Mill Rd
- 701 Carver Mill Rd
- 188 Red Branch Rd
- 701 Dean Mill Rd
- 540 Carver Mill Rd
- 431 Dean Mill Rd
- 975 Dean Mill Rd
- 0 Dean Mill Rd Unit 225463
- 0 Dean Mill Rd Unit 316531
- 0 Dean Mill Rd Unit 10050483
- 0 Dean Mill Rd Unit 7052138
Your Personal Tour Guide
Ask me questions while you tour the home.