56 Red Gate Ln Meredith, NH 03253
Estimated Value: $462,000 - $1,108,000
2
Beds
3
Baths
1,680
Sq Ft
$401/Sq Ft
Est. Value
About This Home
This home is located at 56 Red Gate Ln, Meredith, NH 03253 and is currently estimated at $674,354, approximately $401 per square foot. 56 Red Gate Ln is a home with nearby schools including Inter-Lakes Elementary School, Sandwich Central School, and Inter-Lakes Middle High School.
Ownership History
Date
Name
Owned For
Owner Type
Purchase Details
Closed on
May 3, 2021
Sold by
Carol Y Mickus Ret
Bought by
Allen Joshua R and Allen Kori E
Current Estimated Value
Home Financials for this Owner
Home Financials are based on the most recent Mortgage that was taken out on this home.
Original Mortgage
$229,900
Outstanding Balance
$206,217
Interest Rate
3%
Mortgage Type
Purchase Money Mortgage
Estimated Equity
$468,137
Create a Home Valuation Report for This Property
The Home Valuation Report is an in-depth analysis detailing your home's value as well as a comparison with similar homes in the area
Home Values in the Area
Average Home Value in this Area
Purchase History
| Date | Buyer | Sale Price | Title Company |
|---|---|---|---|
| Allen Joshua R | $242,000 | None Available |
Source: Public Records
Mortgage History
| Date | Status | Borrower | Loan Amount |
|---|---|---|---|
| Open | Allen Joshua R | $229,900 |
Source: Public Records
Tax History
| Year | Tax Paid | Tax Assessment Tax Assessment Total Assessment is a certain percentage of the fair market value that is determined by local assessors to be the total taxable value of land and additions on the property. | Land | Improvement |
|---|---|---|---|---|
| 2024 | $4,915 | $479,000 | $161,000 | $318,000 |
| 2023 | $4,737 | $479,000 | $161,000 | $318,000 |
| 2022 | $4,658 | $333,400 | $108,100 | $225,300 |
| 2021 | $4,478 | $333,400 | $108,100 | $225,300 |
| 2020 | $4,674 | $333,400 | $108,100 | $225,300 |
| 2019 | $4,621 | $290,800 | $85,300 | $205,500 |
| 2018 | $4,541 | $290,700 | $85,300 | $205,400 |
| 2016 | $4,314 | $276,700 | $83,600 | $193,100 |
| 2015 | $4,137 | $272,200 | $83,600 | $188,600 |
| 2014 | $4,037 | $272,200 | $83,600 | $188,600 |
| 2013 | $3,855 | $267,500 | $83,600 | $183,900 |
Source: Public Records
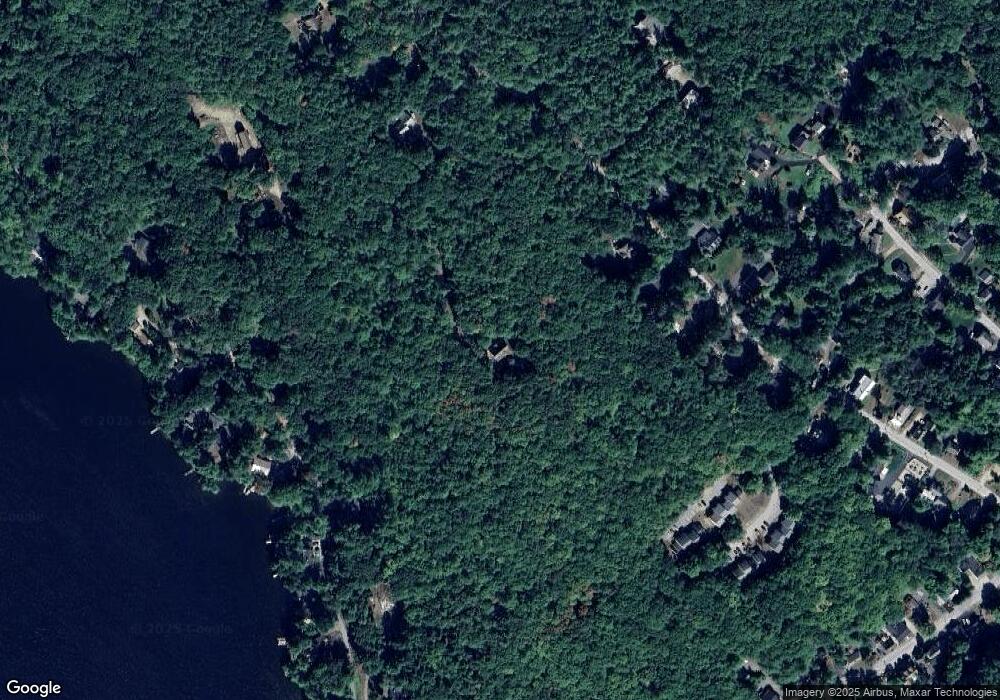
Map
Nearby Homes
- 11 Bonney Shores Rd
- 2 Waukewan Ave
- 21 Upper Ladd Hill Rd
- 105 Nh Route 25
- 34-35-36 Commerce Ct
- 18 Bay Ridge Dr
- 21 Barnard Ridge Rd
- 35 Reservoir Rd
- 20 True Rd Unit 52
- 20 True Rd Unit 101
- 20 True Rd Unit 22
- 20 True Rd Unit 73
- 20 True Rd Unit 94
- 20 True Rd Unit 93
- 8 Oak Knoll Rd
- 11 Birch Ledge Rd
- 53 Oak Knoll Rd
- 57 Winona Rd
- 47 Clover Ridge Rd
- 60 Winona Rd
Your Personal Tour Guide
Ask me questions while you tour the home.