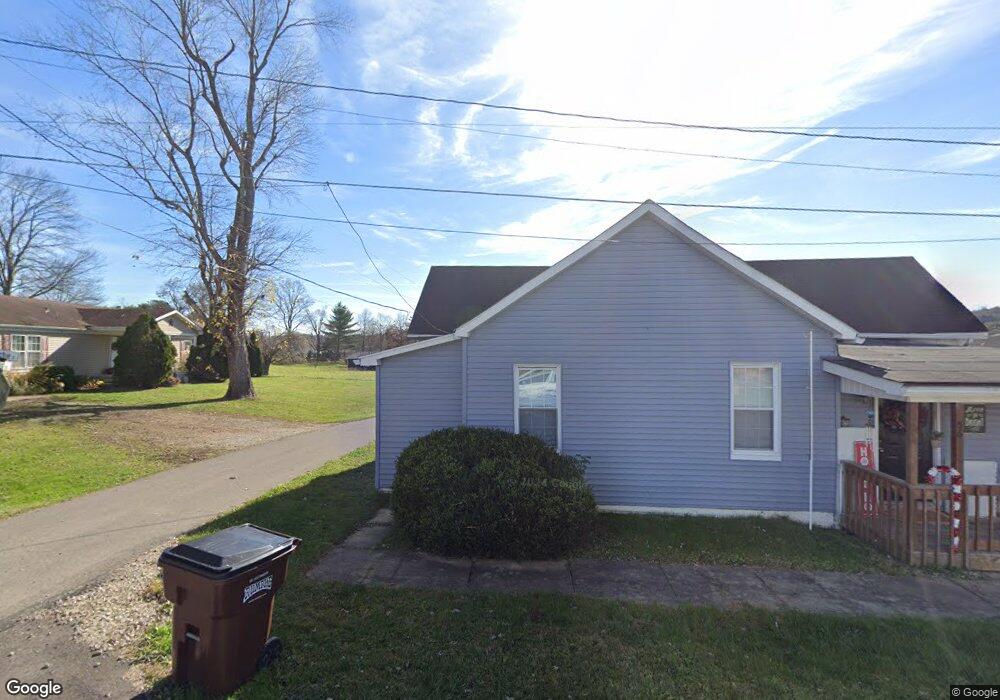
56 Ritchie St South Webster, OH 45682
Estimated Value: $93,000 - $153,000
2
Beds
1
Bath
854
Sq Ft
$148/Sq Ft
Est. Value
About This Home
This home is located at 56 Ritchie St, South Webster, OH 45682 and is currently estimated at $126,031, approximately $147 per square foot. 56 Ritchie St is a home with nearby schools including Bloom-Vernon Elementary School and South Webster Junior/Senior High School.
Ownership History
Date
Name
Owned For
Owner Type
Purchase Details
Closed on
Apr 12, 2023
Sold by
Weist Pete and Weist Megan
Bought by
Moore Karlie
Current Estimated Value
Home Financials for this Owner
Home Financials are based on the most recent Mortgage that was taken out on this home.
Original Mortgage
$113,050
Outstanding Balance
$109,937
Interest Rate
6.65%
Mortgage Type
New Conventional
Estimated Equity
$16,094
Purchase Details
Closed on
Aug 4, 2021
Sold by
Ford Victoria Chamberlin and Patricia Chamberlin Revocable
Bought by
Weist Pete and Weist Megan
Purchase Details
Closed on
Oct 15, 2007
Sold by
Distel Carl D and Distel
Bought by
Chamberlin Patricia J and Patricia J. Chamberlin Revocable Trust U
Purchase Details
Closed on
Sep 5, 2003
Bought by
Distel Carl D + Sandy Gra
Purchase Details
Closed on
Nov 12, 1999
Sold by
Distel Carl D + Ceda D J
Bought by
Distel Carl D
Create a Home Valuation Report for This Property
The Home Valuation Report is an in-depth analysis detailing your home's value as well as a comparison with similar homes in the area
Home Values in the Area
Average Home Value in this Area
Purchase History
| Date | Buyer | Sale Price | Title Company |
|---|---|---|---|
| Moore Karlie | $119,000 | Northwest Title | |
| Weist Pete | $43,000 | Bestitle Agency Inc | |
| Chamberlin Patricia J | -- | -- | |
| Distel Carl D + Sandy Gra | -- | -- | |
| Distel Carl D | -- | -- |
Source: Public Records
Mortgage History
| Date | Status | Borrower | Loan Amount |
|---|---|---|---|
| Open | Moore Karlie | $113,050 |
Source: Public Records
Tax History Compared to Growth
Tax History
| Year | Tax Paid | Tax Assessment Tax Assessment Total Assessment is a certain percentage of the fair market value that is determined by local assessors to be the total taxable value of land and additions on the property. | Land | Improvement |
|---|---|---|---|---|
| 2024 | $777 | $16,690 | $1,480 | $15,210 |
| 2023 | $777 | $16,690 | $1,480 | $15,210 |
| 2022 | $790 | $16,690 | $1,480 | $15,210 |
| 2021 | $1,097 | $16,160 | $1,260 | $14,900 |
| 2020 | $1,571 | $16,160 | $1,260 | $14,900 |
| 2019 | $790 | $14,910 | $1,110 | $13,800 |
| 2018 | $744 | $14,910 | $1,110 | $13,800 |
| 2017 | $734 | $14,910 | $1,110 | $13,800 |
| 2016 | $875 | $15,320 | $1,110 | $14,210 |
| 2015 | $1,438 | $15,320 | $1,110 | $14,210 |
| 2013 | $608 | $15,320 | $1,110 | $14,210 |
Source: Public Records
Map
Nearby Homes
- 302 Essman Sugar Camp Rd
- 501 Webster St
- 101 Mittendorf St
- 0 Bear Run Rd Unit 24453891
- 0 Bear Run Rd Unit 24273256
- 0 Bear Run Rd Unit 11545115
- 929 Jackson Furnace Rd
- 0 Neff Bratton Rd
- 947 Oak Hill Branch Rd
- 0 Dennison Rd
- 15253 Ohio 140
- 0 Burton Rd
- 0 Burton Rd Unit 1849840
- 1453 Jackson Furnace Rd
- 1453 Jackson Furnace Rd Unit 35AC
- 1453 Jackson Furnace Rd Unit 132AC
- 1453 Jackson Furnace Rd Unit 70AC
- 3650 Tick Ridge Rd
- 810 Egypt Rd
- 1065 Kittle Rd
- 30 Jackson St
- 9 McDonald St
- 86 McDonald St
- 2289 S Jackson St
- 11048 State Route 140 St
- 11048 Ohio 140
- 65 N Jackson St
- 96 McDonald St
- 15 McDonald St
- 76 Jackson St
- 82 Jackson St
- 82 N Jackson St
- 101 McDonald St
- 11080 W Main St
- 114 McDonald St
- 111 McDonald St
- 7 Bennett St
- 11030 Main St
- 10949 State Route 140
- 54 N Bennett St