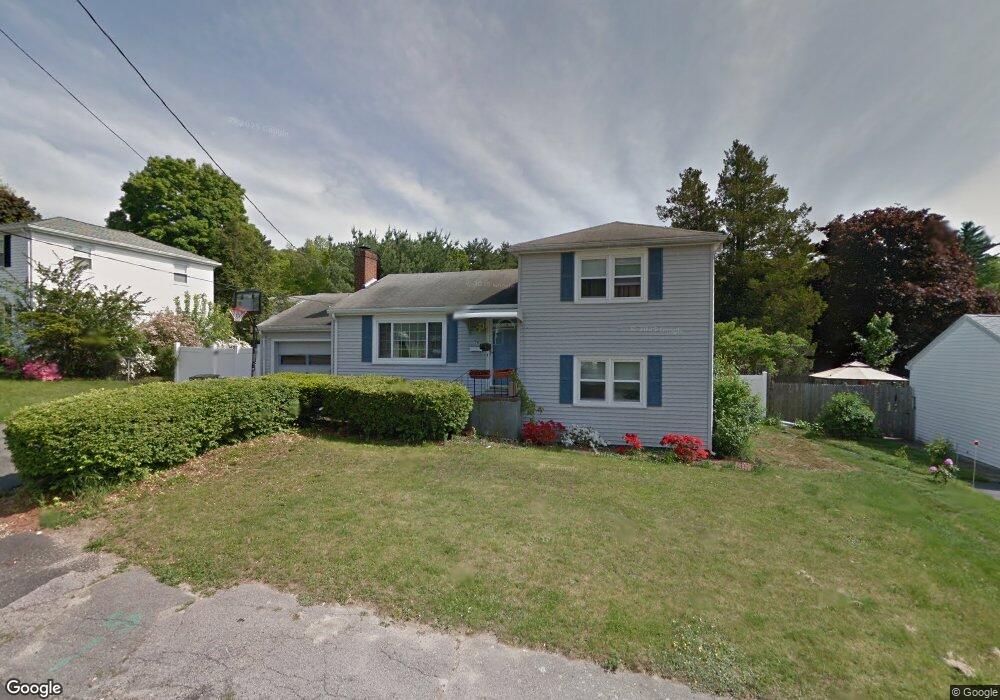
56 Rose Way Holbrook, MA 02343
Estimated Value: $565,000 - $659,000
2
Beds
2
Baths
1,546
Sq Ft
$393/Sq Ft
Est. Value
About This Home
This home is located at 56 Rose Way, Holbrook, MA 02343 and is currently estimated at $607,301, approximately $392 per square foot. 56 Rose Way is a home located in Norfolk County with nearby schools including John F. Kennedy Elementary School, Holbrook Middle High School, and Boston Higashi School.
Ownership History
Date
Name
Owned For
Owner Type
Purchase Details
Closed on
Sep 18, 2009
Sold by
Walls Mary A
Bought by
Walls-Feeley Melissa
Current Estimated Value
Purchase Details
Closed on
Aug 29, 2001
Sold by
Borgstrom Charles H and Borgstrom Patricia M
Bought by
Walls Maryanne and Walls Melissa
Home Financials for this Owner
Home Financials are based on the most recent Mortgage that was taken out on this home.
Original Mortgage
$242,838
Interest Rate
7.06%
Mortgage Type
Purchase Money Mortgage
Create a Home Valuation Report for This Property
The Home Valuation Report is an in-depth analysis detailing your home's value as well as a comparison with similar homes in the area
Home Values in the Area
Average Home Value in this Area
Purchase History
| Date | Buyer | Sale Price | Title Company |
|---|---|---|---|
| Walls-Feeley Melissa | -- | -- | |
| Walls-Feeley Melissa | -- | -- | |
| Walls Maryanne | $247,500 | -- |
Source: Public Records
Mortgage History
| Date | Status | Borrower | Loan Amount |
|---|---|---|---|
| Previous Owner | Walls Maryanne | $242,838 | |
| Previous Owner | Walls Maryanne | $42,300 |
Source: Public Records
Tax History Compared to Growth
Tax History
| Year | Tax Paid | Tax Assessment Tax Assessment Total Assessment is a certain percentage of the fair market value that is determined by local assessors to be the total taxable value of land and additions on the property. | Land | Improvement |
|---|---|---|---|---|
| 2025 | $58 | $443,000 | $219,000 | $224,000 |
| 2024 | $5,734 | $426,600 | $207,800 | $218,800 |
| 2023 | $6,072 | $394,800 | $188,800 | $206,000 |
| 2022 | $5,659 | $343,200 | $171,700 | $171,500 |
| 2021 | $5,605 | $325,500 | $160,400 | $165,100 |
| 2020 | $5,630 | $306,500 | $152,400 | $154,100 |
| 2019 | $5,464 | $280,800 | $136,200 | $144,600 |
| 2018 | $5,703 | $275,900 | $136,200 | $139,700 |
| 2017 | $5,327 | $254,900 | $120,000 | $134,900 |
| 2016 | $4,934 | $251,200 | $120,000 | $131,200 |
| 2015 | $4,703 | $246,500 | $119,000 | $127,500 |
| 2014 | $4,559 | $242,900 | $119,000 | $123,900 |
Source: Public Records
Map
Nearby Homes
- 16 Woodcliff Rd
- 373 N Franklin St
- 6 E Division St
- 104 Milton Rd
- 187 Belcher St
- 29 Woodedge Ave
- 5 Clarendon Cir Unit Lot 4
- 148 N Franklin St
- 61 Woodside Ave
- 27 Winter St
- 63 Cedarhill Rd
- 96 Roberts Ave
- 1501 Liberty St
- 16 Winthrop Ave
- 229 Mill St
- 7 Morton Rd
- 217 Mill St
- 46 Wilmarth Rd
- 152 S Franklin St
- 10 Alfred Terrace