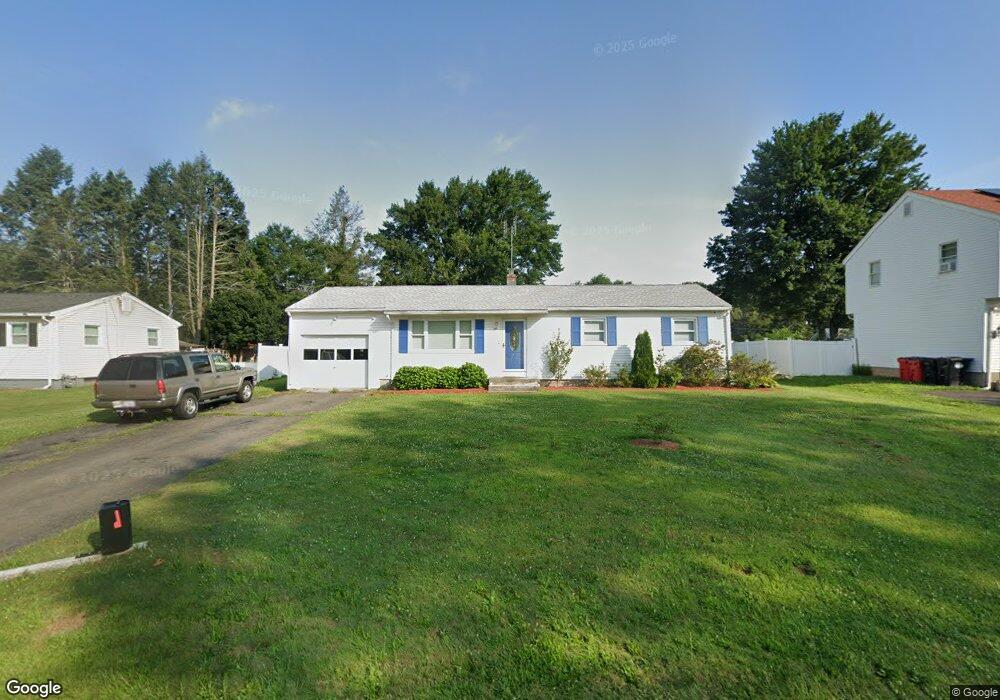
56 Shelley Rd Meriden, CT 06451
South Meriden NeighborhoodEstimated Value: $317,000 - $338,259
3
Beds
1
Bath
1,056
Sq Ft
$306/Sq Ft
Est. Value
About This Home
This home is located at 56 Shelley Rd, Meriden, CT 06451 and is currently estimated at $323,315, approximately $306 per square foot. 56 Shelley Rd is a home located in New Haven County with nearby schools including Hanover School, Lincoln Middle School, and Orville H. Platt High School.
Ownership History
Date
Name
Owned For
Owner Type
Purchase Details
Closed on
Oct 3, 2019
Sold by
Cossette Michelle A Est
Bought by
Vasko Sandor
Current Estimated Value
Purchase Details
Closed on
Jan 21, 1997
Sold by
Cossette Howard A
Bought by
Cossette Michelle A
Create a Home Valuation Report for This Property
The Home Valuation Report is an in-depth analysis detailing your home's value as well as a comparison with similar homes in the area
Home Values in the Area
Average Home Value in this Area
Purchase History
| Date | Buyer | Sale Price | Title Company |
|---|---|---|---|
| Vasko Sandor | $96,500 | None Available | |
| Cossette Michelle A | $50,000 | -- |
Source: Public Records
Mortgage History
| Date | Status | Borrower | Loan Amount |
|---|---|---|---|
| Previous Owner | Cossette Michelle A | $67,846 | |
| Previous Owner | Cossette Michelle A | $45,750 | |
| Previous Owner | Cossette Michelle A | $29,098 | |
| Previous Owner | Cossette Michelle A | $21,842 |
Source: Public Records
Tax History Compared to Growth
Tax History
| Year | Tax Paid | Tax Assessment Tax Assessment Total Assessment is a certain percentage of the fair market value that is determined by local assessors to be the total taxable value of land and additions on the property. | Land | Improvement |
|---|---|---|---|---|
| 2024 | $5,223 | $143,850 | $67,830 | $76,020 |
| 2023 | $5,005 | $143,850 | $67,830 | $76,020 |
| 2022 | $4,746 | $143,850 | $67,830 | $76,020 |
| 2021 | $4,113 | $100,660 | $53,620 | $47,040 |
| 2020 | $4,113 | $100,660 | $53,620 | $47,040 |
| 2019 | $4,113 | $100,660 | $53,620 | $47,040 |
| 2018 | $4,131 | $100,660 | $53,620 | $47,040 |
| 2017 | $4,018 | $100,660 | $53,620 | $47,040 |
| 2016 | $3,756 | $102,550 | $45,850 | $56,700 |
| 2015 | $3,756 | $102,550 | $45,850 | $56,700 |
| 2014 | $3,665 | $102,550 | $45,850 | $56,700 |
Source: Public Records
Map
Nearby Homes