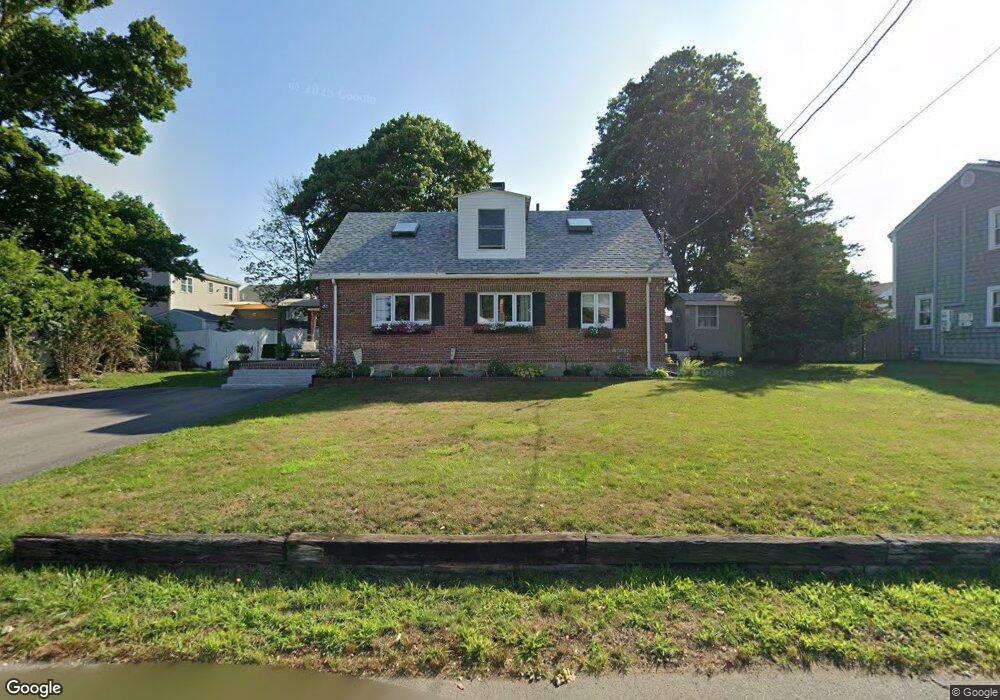
56 Tower Ave Marshfield, MA 02050
Ocean Bluff-Brant Rock NeighborhoodEstimated Value: $658,000 - $715,000
3
Beds
2
Baths
1,547
Sq Ft
$440/Sq Ft
Est. Value
About This Home
This home is located at 56 Tower Ave, Marshfield, MA 02050 and is currently estimated at $681,139, approximately $440 per square foot. 56 Tower Ave is a home located in Plymouth County with nearby schools including Governor Edward Winslow School, Furnace Brook Middle School, and Marshfield High School.
Ownership History
Date
Name
Owned For
Owner Type
Purchase Details
Closed on
Jul 14, 1994
Sold by
Roddy Noreen
Bought by
Singleton Roger J and Mosesso Marianne
Current Estimated Value
Home Financials for this Owner
Home Financials are based on the most recent Mortgage that was taken out on this home.
Original Mortgage
$68,000
Interest Rate
8.51%
Mortgage Type
Purchase Money Mortgage
Create a Home Valuation Report for This Property
The Home Valuation Report is an in-depth analysis detailing your home's value as well as a comparison with similar homes in the area
Home Values in the Area
Average Home Value in this Area
Purchase History
| Date | Buyer | Sale Price | Title Company |
|---|---|---|---|
| Singleton Roger J | $85,000 | -- |
Source: Public Records
Mortgage History
| Date | Status | Borrower | Loan Amount |
|---|---|---|---|
| Open | Singleton Roger J | $100,000 | |
| Closed | Singleton Roger J | $86,000 | |
| Closed | Singleton Roger J | $68,000 |
Source: Public Records
Tax History
| Year | Tax Paid | Tax Assessment Tax Assessment Total Assessment is a certain percentage of the fair market value that is determined by local assessors to be the total taxable value of land and additions on the property. | Land | Improvement |
|---|---|---|---|---|
| 2025 | $5,512 | $556,800 | $319,500 | $237,300 |
| 2024 | $5,359 | $515,800 | $299,500 | $216,300 |
| 2023 | $5,051 | $458,200 | $269,600 | $188,600 |
| 2022 | $5,051 | $390,000 | $229,600 | $160,400 |
| 2021 | $4,788 | $363,000 | $219,600 | $143,400 |
| 2020 | $4,440 | $333,100 | $189,700 | $143,400 |
| 2019 | $4,335 | $324,000 | $189,700 | $134,300 |
| 2018 | $4,245 | $317,500 | $189,700 | $127,800 |
| 2017 | $4,032 | $293,900 | $179,700 | $114,200 |
| 2016 | $3,806 | $274,200 | $169,700 | $104,500 |
| 2015 | $3,641 | $274,000 | $169,700 | $104,300 |
| 2014 | $3,562 | $268,000 | $169,700 | $98,300 |
Source: Public Records
Map
Nearby Homes
- 78 Tower Ave
- 17 Dyke Rd
- 122 June St
- 116 Island St
- 106 Careswell St
- 32 Gratto Rd
- 85 Constitution Rd
- 71 Gurnet Rd
- 116 Outlook Rd
- 30 Chandler Dr
- 42 Carr Rd
- 86 Barouche Dr
- 155 Quincy Ave
- 7 Pierce Rd
- 92 Salt Meadow Waye
- 184 King Phillips Pathe
- 290 S River St
- 242 Enterprise St
- 431 Moraine St
- 236 Powder Point Ave
- 50 Tower Ave
- 53 Donald Rd
- 107 Webster Ave
- 99 Webster Ave
- 99 Webster Ave Unit 1
- 53 Tower Ave
- 104 Hancock St
- 55 Tower Ave
- 42 Tower Ave
- 100 Hancock St
- 123 Webster Ave
- 47 Tower Ave
- 112 Webster Ave
- 108 Webster Ave
- 54 Donald Rd
- 96 Hancock St
- 43 Tower Ave
- 127 Webster Ave
- 104 Webster Ave Unit 1
- 104 Webster Ave
Your Personal Tour Guide
Ask me questions while you tour the home.