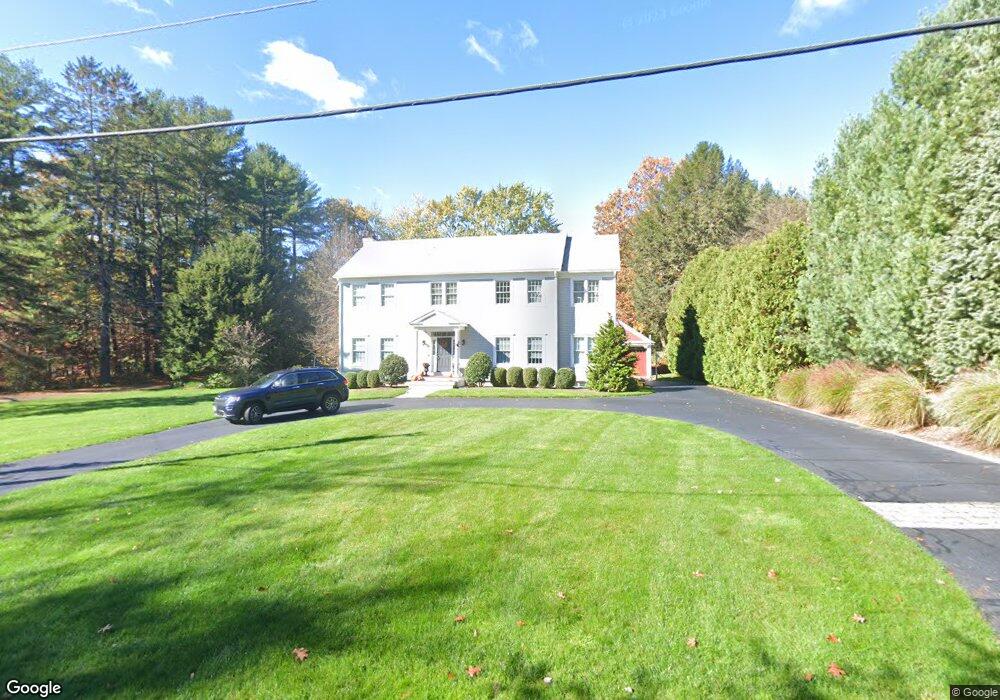
56 Westland Rd Weston, MA 02493
Estimated Value: $2,078,034 - $2,499,000
6
Beds
4
Baths
3,313
Sq Ft
$682/Sq Ft
Est. Value
About This Home
This home is located at 56 Westland Rd, Weston, MA 02493 and is currently estimated at $2,258,509, approximately $681 per square foot. 56 Westland Rd is a home located in Middlesex County with nearby schools including Country Elementary School, Woodland Elementary School, and Weston Middle School.
Ownership History
Date
Name
Owned For
Owner Type
Purchase Details
Closed on
Nov 1, 2013
Sold by
Bennett Anne H
Bought by
Darling Thomas L and Darling Elizabeth W
Current Estimated Value
Home Financials for this Owner
Home Financials are based on the most recent Mortgage that was taken out on this home.
Original Mortgage
$417,000
Outstanding Balance
$314,520
Interest Rate
4.52%
Mortgage Type
New Conventional
Estimated Equity
$1,943,989
Purchase Details
Closed on
Oct 26, 2012
Sold by
Bennett David C and Bennett Anne H
Bought by
Bennett Anne H
Purchase Details
Closed on
Nov 23, 1993
Sold by
Mcintosh Robert W and Mcintosh Carolyn B
Bought by
Bennett David C and Bennett Anne H
Create a Home Valuation Report for This Property
The Home Valuation Report is an in-depth analysis detailing your home's value as well as a comparison with similar homes in the area
Home Values in the Area
Average Home Value in this Area
Purchase History
| Date | Buyer | Sale Price | Title Company |
|---|---|---|---|
| Darling Thomas L | $1,190,000 | -- | |
| Darling Thomas L | $1,190,000 | -- | |
| Bennett Anne H | -- | -- | |
| Bennett David C | $270,000 | -- |
Source: Public Records
Mortgage History
| Date | Status | Borrower | Loan Amount |
|---|---|---|---|
| Open | Darling Thomas L | $417,000 | |
| Closed | Darling Thomas L | $417,000 | |
| Previous Owner | Bennett David C | $150,000 | |
| Previous Owner | Bennett David C | $192,000 | |
| Previous Owner | Bennett David C | $110,000 |
Source: Public Records
Tax History Compared to Growth
Tax History
| Year | Tax Paid | Tax Assessment Tax Assessment Total Assessment is a certain percentage of the fair market value that is determined by local assessors to be the total taxable value of land and additions on the property. | Land | Improvement |
|---|---|---|---|---|
| 2025 | $19,677 | $1,772,700 | $865,000 | $907,700 |
| 2024 | $19,385 | $1,743,300 | $865,000 | $878,300 |
| 2023 | $19,489 | $1,646,000 | $865,000 | $781,000 |
| 2022 | $19,075 | $1,489,100 | $826,800 | $662,300 |
| 2021 | $17,439 | $1,343,500 | $784,200 | $559,300 |
| 2020 | $17,237 | $1,343,500 | $784,200 | $559,300 |
| 2019 | $15,030 | $1,193,800 | $726,100 | $467,700 |
| 2018 | $2,901 | $1,199,300 | $726,100 | $473,200 |
| 2017 | $14,940 | $1,204,800 | $726,100 | $478,700 |
| 2016 | $14,716 | $1,210,200 | $726,100 | $484,100 |
| 2015 | $14,339 | $1,167,700 | $691,700 | $476,000 |
Source: Public Records
Map
Nearby Homes
- 75 Westland Rd
- 6 Clifford Ln
- 121 Cherry Brook Rd
- 3 Clifford Ln
- 5 Peakes Ln
- 51 Willard Rd
- 1 Aberdeen Rd
- 3 October Ln
- 130 Tower Rd
- 416 Conant Rd
- 426 Conant Rd
- 167 Conant Rd
- 12 Laurel Dr
- 6 Overlook Dr
- 19 Conant Rd
- 11 Winthrop Cir
- 93 Old Sudbury Rd
- 15 Whitney Tavern Rd
- 24 Jericho Rd Unit 24
- 8 Jericho Rd Unit 8
- 60 Westland Rd
- 0 Wildwood Ln
- 21 Circle Dr
- 52 Westland Rd
- 8 Wildwood Ln Unit 8A
- 8 Wildwood Ln Unit 8C
- 8 Wildwood Ln Unit 12
- 8 Wildwood Ln Unit 10
- 8 Wildwood Ln Unit B
- 64 Westland Rd
- 51 Westland Rd
- 50 Westland Rd
- 61 Westland Rd
- 31 Circle Dr
- 25 Circle Dr
- 25 Circle Dr Unit Rental Home
- 25 Circle Dr Unit Single Home
- 25 Circle Dr Unit Rental
- 25 Circle Dr Unit HOUSE25
- 68 Westland Rd