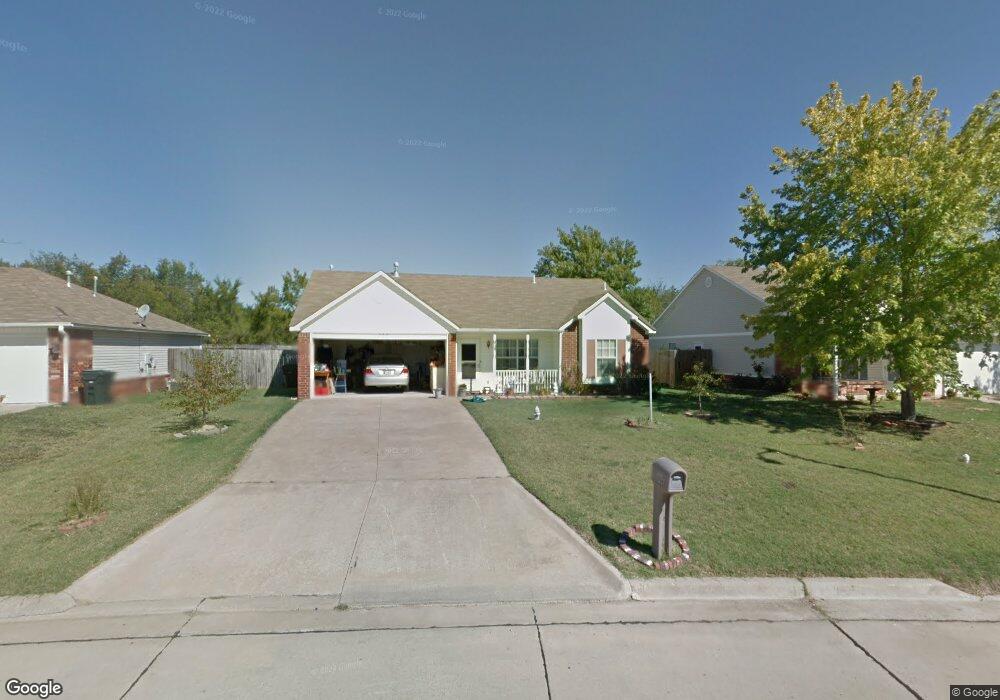
560 Buckingham Dr Claremore, OK 74017
3
Beds
2
Baths
1,173
Sq Ft
--
Built
About This Home
This home is located at 560 Buckingham Dr, Claremore, OK 74017. 560 Buckingham Dr is a home located in Rogers County with nearby schools including Roosa Elementary School, Will Rogers Junior High School, and Claremore High School.
Ownership History
Date
Name
Owned For
Owner Type
Purchase Details
Closed on
Nov 30, 2020
Sold by
Cox Richard and Cox Karen
Bought by
Hewitt Kenneth
Home Financials for this Owner
Home Financials are based on the most recent Mortgage that was taken out on this home.
Original Mortgage
$127,542
Outstanding Balance
$102,459
Interest Rate
2.8%
Mortgage Type
Stand Alone Second
Purchase Details
Closed on
Sep 25, 2017
Sold by
Reed Mary
Bought by
Cox Richard and Cox Karen
Home Financials for this Owner
Home Financials are based on the most recent Mortgage that was taken out on this home.
Original Mortgage
$112,818
Interest Rate
3.99%
Mortgage Type
FHA
Purchase Details
Closed on
Oct 19, 2005
Sold by
Whittlock Michael D and Whitlock Bridget L
Bought by
Reed Bert and Reed Mary
Home Financials for this Owner
Home Financials are based on the most recent Mortgage that was taken out on this home.
Original Mortgage
$94,519
Interest Rate
5.69%
Mortgage Type
VA
Purchase Details
Closed on
Nov 28, 2000
Sold by
Chumley & Associates Inc
Create a Home Valuation Report for This Property
The Home Valuation Report is an in-depth analysis detailing your home's value as well as a comparison with similar homes in the area
Home Values in the Area
Average Home Value in this Area
Purchase History
| Date | Buyer | Sale Price | Title Company |
|---|---|---|---|
| Hewitt Kenneth | $125,000 | Title Clearing & Escrow Llc | |
| Cox Richard | $115,000 | Titan Title & Closing | |
| Reed Bert | $91,500 | Land Title Closing Services | |
| -- | $86,300 | -- |
Source: Public Records
Mortgage History
| Date | Status | Borrower | Loan Amount |
|---|---|---|---|
| Open | Hewitt Kenneth | $127,542 | |
| Previous Owner | Cox Richard | $112,818 | |
| Previous Owner | Reed Bert | $94,519 |
Source: Public Records
Tax History Compared to Growth
Tax History
| Year | Tax Paid | Tax Assessment Tax Assessment Total Assessment is a certain percentage of the fair market value that is determined by local assessors to be the total taxable value of land and additions on the property. | Land | Improvement |
|---|---|---|---|---|
| 2025 | $1,480 | $15,707 | $2,743 | $12,964 |
| 2024 | $1,480 | $16,018 | $1,941 | $14,077 |
| 2023 | $1,480 | $15,255 | $2,200 | $13,055 |
| 2022 | $1,345 | $14,529 | $2,200 | $12,329 |
| 2021 | $1,222 | $13,837 | $2,200 | $11,637 |
| 2020 | $1,067 | $13,028 | $1,925 | $11,103 |
| 2019 | $1,045 | $12,280 | $1,925 | $10,355 |
| 2018 | $1,176 | $12,732 | $1,925 | $10,807 |
| 2017 | $638 | $7,952 | $1,385 | $6,567 |
| 2016 | $652 | $7,952 | $1,420 | $6,532 |
| 2015 | $645 | $7,953 | $1,586 | $6,367 |
| 2014 | $645 | $7,952 | $1,558 | $6,394 |
Source: Public Records
Map
Nearby Homes
- 531 Buckingham Dr
- 1805 NE Oakridge Dr
- 326 E 15th St
- 1411 N Choctaw Place
- 1335 N Mcfarland Place
- 1216 N Sioux Ave
- 2701 Spring Creek St
- 305 E Falletti Ave
- 18774 S Birch Hollow Way
- 1119 N Oklahoma Ave
- 1119 N Kansas Ave
- 103 E 12th Place
- 1027 N Miller Dr
- 401 W Blue Starr Dr
- 419 E 12th St
- 1012 N Osage Ave
- 19805 S Lake Dr
- 0 N J M Davis Blvd
- 13414 E 463 Rd
- 119 N Missouri Ave
- 560 Buckingham Rd
- 600 Buckingham Rd
- 600 Buckingham Dr
- 550 Buckingham Dr
- 550 Buckingham Rd
- 610 Buckingham Rd
- 540 Buckingham Dr
- 540 Buckingham Rd
- 551 Buckingham Rd
- 620 Buckingham Rd
- 620 Buckingham Dr
- 1930 Lexington Rd
- 541 Buckingham Dr
- 541 Buckingham Rd
- 530 Buckingham Rd
- 531 Buckingham Rd
- 1928 Lexington Rd
- 640 Buckingham Dr
- 520 Buckingham Dr
- 520 Buckingham Rd