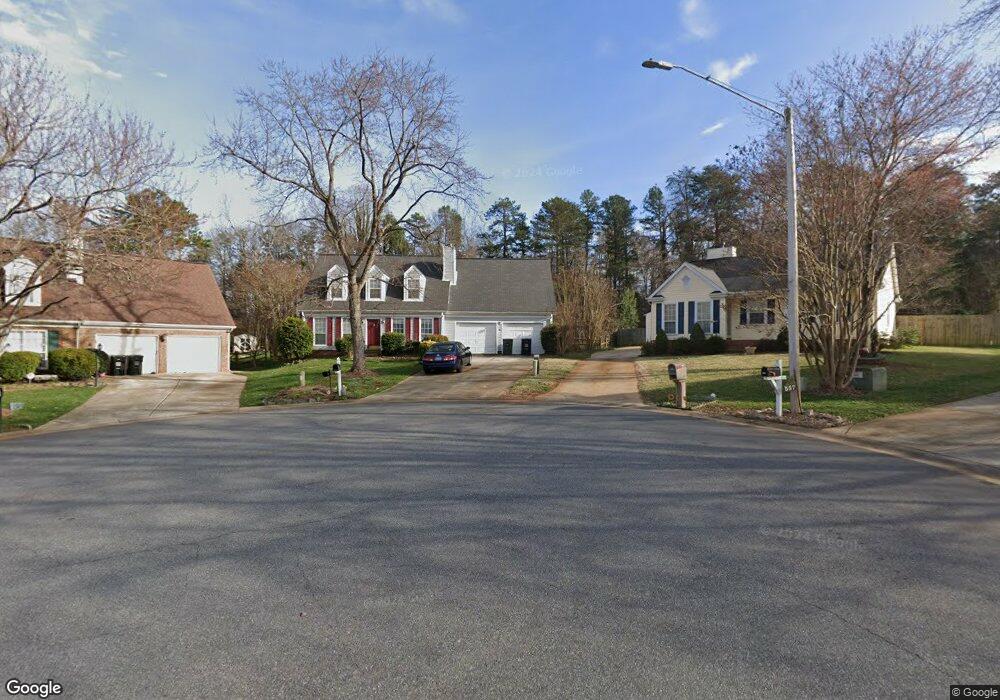
560 Garrison Ct SW Concord, NC 28025
Estimated Value: $328,000 - $369,908
3
Beds
3
Baths
1,803
Sq Ft
$195/Sq Ft
Est. Value
About This Home
This home is located at 560 Garrison Ct SW, Concord, NC 28025 and is currently estimated at $351,977, approximately $195 per square foot. 560 Garrison Ct SW is a home located in Cabarrus County with nearby schools including Rocky River Elementary School, J.N. Fries Middle School, and Branch Christian Academy.
Ownership History
Date
Name
Owned For
Owner Type
Purchase Details
Closed on
Sep 16, 2022
Sold by
Investcar Llc
Bought by
Ams Realty Llc
Current Estimated Value
Purchase Details
Closed on
Feb 28, 2005
Sold by
Forquer Patricia H
Bought by
Trexler Steven E
Home Financials for this Owner
Home Financials are based on the most recent Mortgage that was taken out on this home.
Original Mortgage
$123,093
Interest Rate
5.68%
Mortgage Type
Purchase Money Mortgage
Purchase Details
Closed on
Feb 15, 2000
Sold by
Forquer Paul D
Bought by
Forquer Patricia H
Purchase Details
Closed on
May 1, 1990
Bought by
Forquer Paul D and Forquer Wife
Create a Home Valuation Report for This Property
The Home Valuation Report is an in-depth analysis detailing your home's value as well as a comparison with similar homes in the area
Home Values in the Area
Average Home Value in this Area
Purchase History
| Date | Buyer | Sale Price | Title Company |
|---|---|---|---|
| Ams Realty Llc | $255,000 | -- | |
| Investcar Llc | $209,000 | -- | |
| Trexler Steven E | $127,000 | Colonial Title | |
| Forquer Patricia H | -- | -- | |
| Forquer Paul D | $97,500 | -- |
Source: Public Records
Mortgage History
| Date | Status | Borrower | Loan Amount |
|---|---|---|---|
| Previous Owner | Trexler Steven E | $123,093 |
Source: Public Records
Tax History Compared to Growth
Tax History
| Year | Tax Paid | Tax Assessment Tax Assessment Total Assessment is a certain percentage of the fair market value that is determined by local assessors to be the total taxable value of land and additions on the property. | Land | Improvement |
|---|---|---|---|---|
| 2025 | $2,811 | $282,270 | $65,000 | $217,270 |
| 2024 | $2,811 | $282,270 | $65,000 | $217,270 |
| 2023 | $2,187 | $179,260 | $40,000 | $139,260 |
| 2022 | $2,187 | $179,260 | $40,000 | $139,260 |
| 2021 | $2,187 | $179,260 | $40,000 | $139,260 |
| 2020 | $2,187 | $179,260 | $40,000 | $139,260 |
| 2019 | $1,546 | $126,700 | $17,000 | $109,700 |
| 2018 | $1,520 | $126,700 | $17,000 | $109,700 |
| 2017 | $1,495 | $126,700 | $17,000 | $109,700 |
| 2016 | $887 | $121,570 | $17,000 | $104,570 |
| 2015 | $1,435 | $121,570 | $17,000 | $104,570 |
| 2014 | $1,435 | $121,570 | $17,000 | $104,570 |
Source: Public Records
Map
Nearby Homes
- 493 Debra Cir SW
- 518 Viking Place SW
- 3073 Champion Ln SW
- 3168 Sossamon Place
- 2824 Trestle Ct SW
- 2893 Signal Ct SW
- 609 Faith Dr SW Unit 1
- 1255 Old Charlotte Rd
- Lot #2 Faith Dr SW
- 4285 Long Arrow Dr
- 809 Fargo Dr SW
- 1067 Old Charlotte Rd
- 84 Highland Ave SW
- 82 Highland Ave SW
- 782 Chalice St SW
- 758 Main St SW
- 668 Shellbark Dr
- 664 Jackson Terrace SW
- 668 Jackson Terrace SW
- 760 Bartram Ave Unit 114
- 556 Garrison Ct SW
- 561 Garrison Ct SW
- 557 Garrison Ct SW
- 557 Garrison Ct SW Unit 37
- 3025 Parade Ln SW
- 552 Garrison Ct SW
- 553 Garrison Ct SW
- 3029 Parade Ln SW
- 3021 Parade Ln SW
- 3033 Parade Ln SW
- 548 Garrison Ct SW
- 549 Garrison Ct SW
- 3037 Parade Ln SW
- 370 Lloyd Garmon Ln
- 498 Debra Cir SW
- 3020 Parade Ln SW
- 494 Debra Cir SW
- 502 Debra Cir SW
- 3041 Parade Ln SW
- 544 Garrison Ct SW