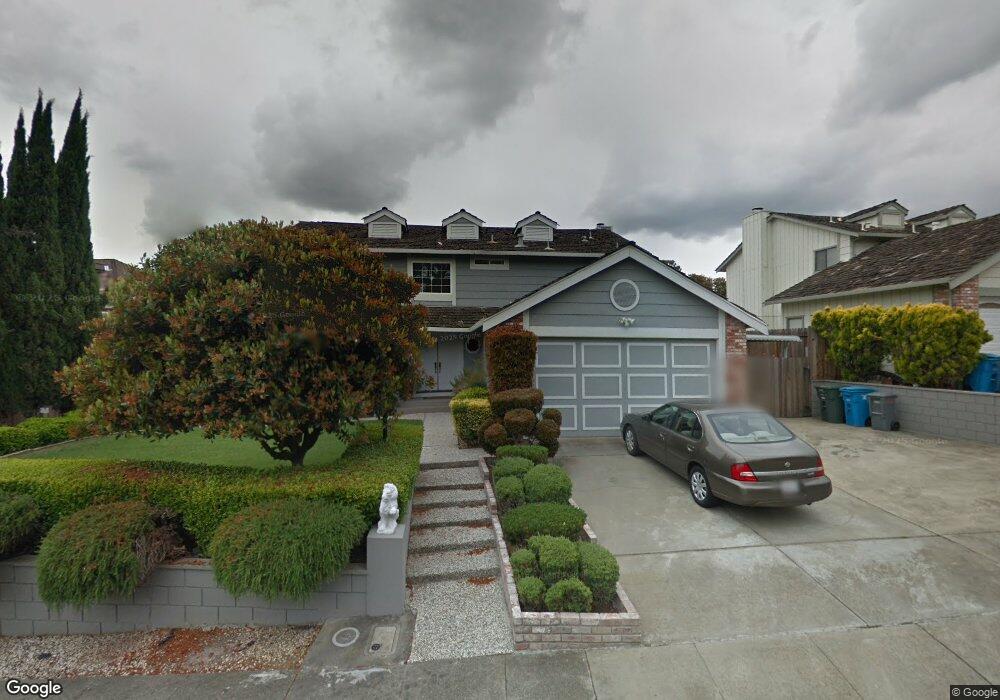
560 Goheen Cir Vallejo, CA 94591
Estimated Value: $650,000 - $757,000
4
Beds
3
Baths
2,536
Sq Ft
$269/Sq Ft
Est. Value
About This Home
This home is located at 560 Goheen Cir, Vallejo, CA 94591 and is currently estimated at $681,395, approximately $268 per square foot. 560 Goheen Cir is a home located in Solano County with nearby schools including Joseph H. Wardlaw Elementary School, Hogan Middle School, and Jesse M. Bethel High School.
Ownership History
Date
Name
Owned For
Owner Type
Purchase Details
Closed on
Oct 26, 2022
Sold by
Ancheta Melinda V and Ancheta Jermaine Maxwell
Bought by
Guilbeaux Jermaine Maxwell and Guilbeaux Rhoda Marie
Current Estimated Value
Purchase Details
Closed on
May 20, 2022
Sold by
Ancheta Melinda V
Bought by
Ancheta Melinda V and Guilbeaux Jermaine Maxwell
Purchase Details
Closed on
Oct 31, 2007
Sold by
Ancheta Melinda V
Bought by
Ancheta Melinda
Home Financials for this Owner
Home Financials are based on the most recent Mortgage that was taken out on this home.
Original Mortgage
$66,237
Interest Rate
6.4%
Mortgage Type
Credit Line Revolving
Purchase Details
Closed on
Oct 22, 2007
Sold by
Ancheta Rodrigo G
Bought by
Ancheta Melinda
Home Financials for this Owner
Home Financials are based on the most recent Mortgage that was taken out on this home.
Original Mortgage
$66,237
Interest Rate
6.4%
Mortgage Type
Credit Line Revolving
Create a Home Valuation Report for This Property
The Home Valuation Report is an in-depth analysis detailing your home's value as well as a comparison with similar homes in the area
Purchase History
| Date | Buyer | Sale Price | Title Company |
|---|---|---|---|
| Guilbeaux Jermaine Maxwell | -- | -- | |
| Ancheta Melinda V | $918,000 | None Listed On Document | |
| Ancheta Melinda | -- | First Amer Title Co Of Napa | |
| Ancheta Melinda | -- | None Available |
Source: Public Records
Mortgage History
| Date | Status | Borrower | Loan Amount |
|---|---|---|---|
| Previous Owner | Ancheta Melinda | $66,237 | |
| Previous Owner | Ancheta Melinda | $417,000 | |
| Closed | Ancheta Melinda V | $0 |
Source: Public Records
Tax History
| Year | Tax Paid | Tax Assessment Tax Assessment Total Assessment is a certain percentage of the fair market value that is determined by local assessors to be the total taxable value of land and additions on the property. | Land | Improvement |
|---|---|---|---|---|
| 2025 | $4,727 | $294,211 | $62,150 | $232,061 |
| 2024 | $4,727 | $288,443 | $60,932 | $227,511 |
| 2023 | $4,464 | $282,788 | $59,738 | $223,050 |
| 2022 | $4,363 | $277,244 | $58,568 | $218,676 |
| 2021 | $4,268 | $271,809 | $57,420 | $214,389 |
| 2020 | $4,281 | $269,023 | $56,832 | $212,191 |
| 2019 | $4,154 | $263,749 | $55,718 | $208,031 |
| 2018 | $3,902 | $258,578 | $54,626 | $203,952 |
| 2017 | $3,735 | $253,508 | $53,555 | $199,953 |
| 2016 | $3,160 | $248,538 | $52,505 | $196,033 |
| 2015 | $3,118 | $244,806 | $51,717 | $193,089 |
| 2014 | $3,073 | $240,011 | $50,704 | $189,307 |
Source: Public Records
Map
Nearby Homes
- 272 Woodridge Dr
- 125 Skyline Ct
- 419 Clark Dr
- 112 Palomar Ln
- 2890 Redwood Pkwy Unit 61
- 151 Kathy Ellen Ct
- 164 Kathy Ellen Dr
- 373 Clydesdale Dr
- 103 Stageline Ct
- 1014 Henry Ct
- 2512 Tennessee St
- 367 Darley Dr
- 136 Evergreen Way
- 124 Gregory Ln
- 121 Jackson Way
- 129 Foster St
- 1408 Arkansas St
- 1441 Arkansas St
- 108 Revere St
- 187 Fleming Ave
Your Personal Tour Guide
Ask me questions while you tour the home.