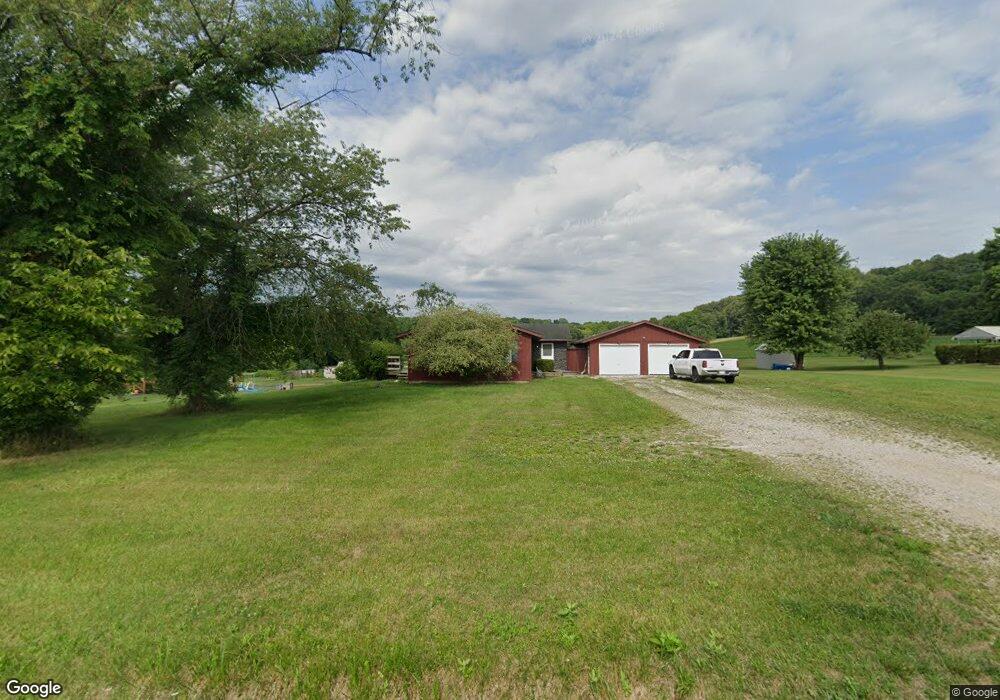
560 Harlan Rd Mansfield, OH 44903
Estimated Value: $197,000 - $259,000
4
Beds
2
Baths
1,632
Sq Ft
$141/Sq Ft
Est. Value
About This Home
This home is located at 560 Harlan Rd, Mansfield, OH 44903 and is currently estimated at $229,893, approximately $140 per square foot. 560 Harlan Rd is a home located in Richland County with nearby schools including Madison High School.
Ownership History
Date
Name
Owned For
Owner Type
Purchase Details
Closed on
Sep 4, 2019
Sold by
Miller Jeffery T and Miller Amy S
Bought by
Washington Anthony
Current Estimated Value
Home Financials for this Owner
Home Financials are based on the most recent Mortgage that was taken out on this home.
Original Mortgage
$111,343
Outstanding Balance
$97,727
Interest Rate
3.7%
Mortgage Type
VA
Estimated Equity
$132,166
Purchase Details
Closed on
Dec 28, 2010
Sold by
Saylor Donald R and Saylor Patricia R
Bought by
Miller Jeffery T and Miller Amy S
Home Financials for this Owner
Home Financials are based on the most recent Mortgage that was taken out on this home.
Original Mortgage
$59,500
Interest Rate
3.99%
Mortgage Type
Future Advance Clause Open End Mortgage
Purchase Details
Closed on
Dec 23, 2008
Sold by
Saylor John E
Bought by
Saylor Donald R and Saylor Patricia R
Create a Home Valuation Report for This Property
The Home Valuation Report is an in-depth analysis detailing your home's value as well as a comparison with similar homes in the area
Home Values in the Area
Average Home Value in this Area
Purchase History
| Date | Buyer | Sale Price | Title Company |
|---|---|---|---|
| Washington Anthony | $109,000 | Southern Title | |
| Miller Jeffery T | $70,000 | Chicago Title | |
| Saylor Donald R | -- | Attorney |
Source: Public Records
Mortgage History
| Date | Status | Borrower | Loan Amount |
|---|---|---|---|
| Open | Washington Anthony | $111,343 | |
| Previous Owner | Miller Jeffery T | $59,500 |
Source: Public Records
Tax History
| Year | Tax Paid | Tax Assessment Tax Assessment Total Assessment is a certain percentage of the fair market value that is determined by local assessors to be the total taxable value of land and additions on the property. | Land | Improvement |
|---|---|---|---|---|
| 2024 | $2,974 | $57,620 | $8,840 | $48,780 |
| 2023 | $2,974 | $57,620 | $8,840 | $48,780 |
| 2022 | $2,317 | $41,120 | $7,080 | $34,040 |
| 2021 | $2,316 | $41,120 | $7,080 | $34,040 |
| 2020 | $2,334 | $41,120 | $7,080 | $34,040 |
| 2019 | $2,118 | $34,780 | $5,950 | $28,830 |
| 2018 | $2,101 | $34,780 | $5,950 | $28,830 |
| 2017 | $2,062 | $34,780 | $5,950 | $28,830 |
| 2016 | $1,490 | $24,520 | $5,950 | $18,570 |
| 2015 | $1,490 | $24,520 | $5,950 | $18,570 |
| 2014 | $1,461 | $24,520 | $5,950 | $18,570 |
| 2012 | $673 | $24,520 | $5,950 | $18,570 |
Source: Public Records
Map
Nearby Homes
- 0 Mount Zion Rd Unit 9069748
- 2515 Peterson Rd
- 775 Touby Ln
- 0 Peterson Rd
- 945 Pike Dr
- 1117 County Road 2075
- 1661 State Route 603
- 1153 County Road 30a
- 0 McBride Road Parcel # 1 Unit 9066028
- 640 Running Brook Way
- 620 Running Brook Way
- 76 Ford Rd N
- 76 Ford Rd N Unit Lot 59
- 27 E Main St
- 2778 Lucas Perrysville Rd
- 0 Mcelroy Rd
- 0 State Route 39 & I-71 Northeast Quadrant
- 0 State Route 39 & I-71 Southeast Quadrant
- 1851 State Route 39
- 1674 Honeysuckle Dr
Your Personal Tour Guide
Ask me questions while you tour the home.