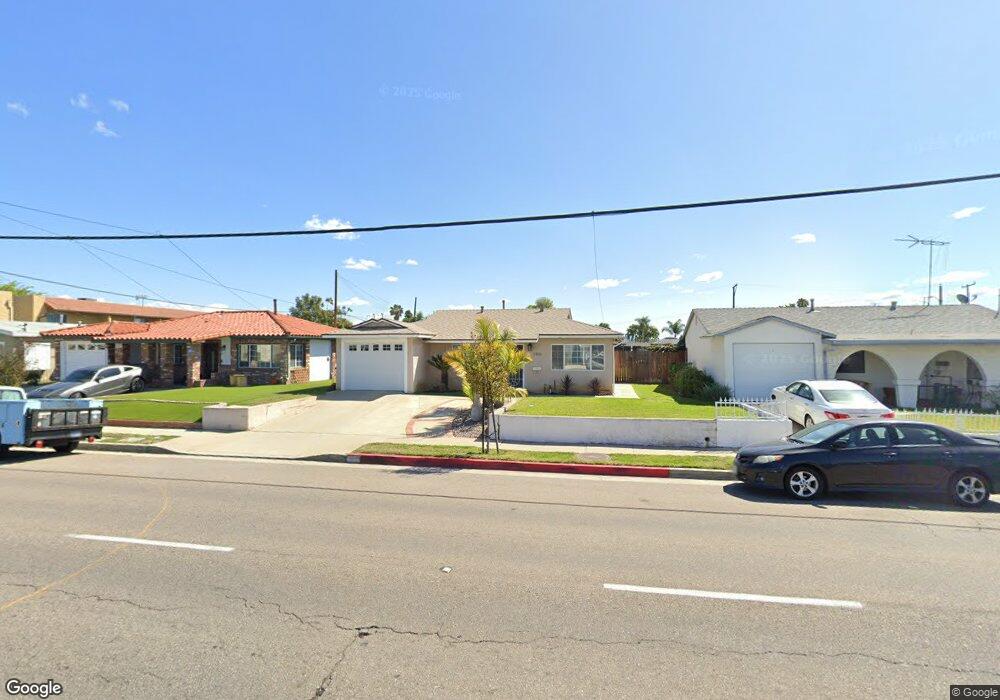
560 S Euclid St La Habra, CA 90631
Estimated Value: $666,442 - $792,000
3
Beds
1
Bath
883
Sq Ft
$819/Sq Ft
Est. Value
About This Home
This home is located at 560 S Euclid St, La Habra, CA 90631 and is currently estimated at $722,861, approximately $818 per square foot. 560 S Euclid St is a home located in Orange County with nearby schools including Las Lomas Elementary School, Imperial Middle School, and Sonora High School.
Ownership History
Date
Name
Owned For
Owner Type
Purchase Details
Closed on
May 9, 2020
Sold by
Marquez Bertha M
Bought by
Marquez Bertha Mary and Bertha Mary Marquez Living Tr
Current Estimated Value
Purchase Details
Closed on
Sep 27, 2012
Sold by
Marquez Marcelino V
Bought by
Marquez Bertha M
Home Financials for this Owner
Home Financials are based on the most recent Mortgage that was taken out on this home.
Original Mortgage
$79,621
Interest Rate
3.52%
Mortgage Type
New Conventional
Purchase Details
Closed on
Mar 25, 2010
Sold by
Navarro Adrianne Renee
Bought by
Marquez Bertha M
Purchase Details
Closed on
May 27, 2009
Sold by
Navarro Steve
Bought by
Navarro Adrianne Renee
Purchase Details
Closed on
Jan 29, 2002
Sold by
Marquez Marcelino V
Bought by
Marquez Bertha
Home Financials for this Owner
Home Financials are based on the most recent Mortgage that was taken out on this home.
Original Mortgage
$90,000
Interest Rate
7.04%
Create a Home Valuation Report for This Property
The Home Valuation Report is an in-depth analysis detailing your home's value as well as a comparison with similar homes in the area
Home Values in the Area
Average Home Value in this Area
Purchase History
| Date | Buyer | Sale Price | Title Company |
|---|---|---|---|
| Marquez Bertha Mary | -- | None Available | |
| Marquez Bertha M | -- | Equity Title Company | |
| Marquez Bertha M | -- | None Available | |
| Navarro Adrianne Renee | -- | None Available | |
| Navarro Adrianne Renee | -- | None Available | |
| Marquez Bertha | -- | Commerce Title |
Source: Public Records
Mortgage History
| Date | Status | Borrower | Loan Amount |
|---|---|---|---|
| Closed | Marquez Bertha M | $79,621 | |
| Closed | Marquez Bertha | $90,000 |
Source: Public Records
Tax History Compared to Growth
Tax History
| Year | Tax Paid | Tax Assessment Tax Assessment Total Assessment is a certain percentage of the fair market value that is determined by local assessors to be the total taxable value of land and additions on the property. | Land | Improvement |
|---|---|---|---|---|
| 2025 | $905 | $55,282 | $22,822 | $32,460 |
| 2024 | $905 | $54,199 | $22,375 | $31,824 |
| 2023 | $879 | $53,137 | $21,937 | $31,200 |
| 2022 | $861 | $52,096 | $21,507 | $30,589 |
| 2021 | $847 | $51,075 | $21,085 | $29,990 |
| 2020 | $915 | $50,552 | $20,869 | $29,683 |
| 2019 | $898 | $49,561 | $20,460 | $29,101 |
| 2018 | $885 | $48,590 | $20,059 | $28,531 |
| 2017 | $871 | $47,638 | $19,666 | $27,972 |
| 2016 | $854 | $46,704 | $19,280 | $27,424 |
| 2015 | $833 | $46,003 | $18,990 | $27,013 |
| 2014 | $811 | $45,102 | $18,618 | $26,484 |
Source: Public Records
Map
Nearby Homes
- 601 S Euclid St Unit 4
- 208 W Olive Ave Unit B
- 211 W Mountain View Ave
- 621 S Olive Ave
- 303 S Cadiz Ct
- 405 W Mountain View Ave
- 405 W Mountain View Ave Unit 13
- 418 W Olive Ave
- 414 W Olive Ave
- 313 W 1st Ave Unit M
- 570 E 2nd Ave
- 1001 W Lambert Rd Unit 127
- 1001 W Lambert Rd Unit 116
- 1001 W Lambert Rd Unit 20
- 1001 W Lambert Rd Unit 284
- 1001 W Lambert Rd Unit 87
- 1001 W Lambert Rd Unit 146
- 630 W Lambert Rd Unit 24
- 221 Chinchilla St
- 401 Buena Vista Ave
- 550 S Euclid St
- 590 S Euclid St
- 121 Darby Ct
- 540 S Euclid St
- 600 S Euclid St
- 131 Darby Ct
- 610 S Euclid St
- 522 S Euclid St Unit F
- 522 S Euclid St Unit 1
- 522 S Euclid St Unit B
- 522 S Euclid St Unit 9
- 522 S Euclid St Unit E
- 522 S Euclid St Unit H
- 522 S Euclid St Unit 6
- 522 S Euclid St Unit 4
- 522 S Euclid St Unit J
- 522 S Euclid St Unit G
- 522 S Euclid St Unit 5
- 522 S Euclid St Unit C
- 522 S Euclid St Unit 2