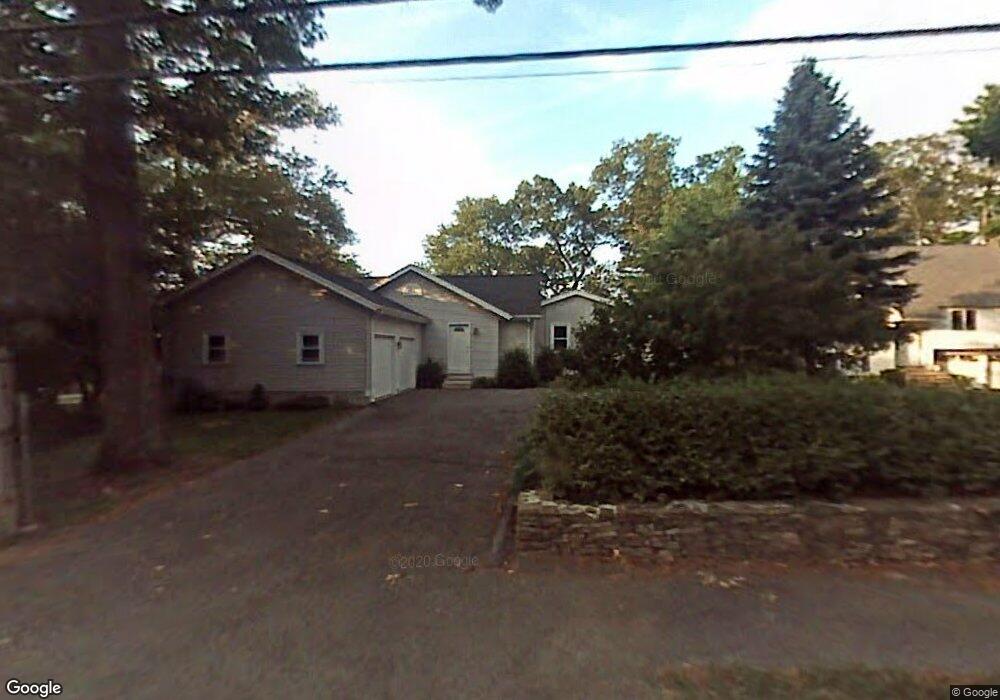
560 Summer St Lynnfield, MA 01940
Estimated Value: $949,819 - $1,123,000
2
Beds
3
Baths
2,552
Sq Ft
$400/Sq Ft
Est. Value
About This Home
This home is located at 560 Summer St, Lynnfield, MA 01940 and is currently estimated at $1,021,955, approximately $400 per square foot. 560 Summer St is a home located in Essex County with nearby schools including Lynnfield Middle School, Lynnfield High School, and Our Lady Of Assumption School.
Ownership History
Date
Name
Owned For
Owner Type
Purchase Details
Closed on
Apr 23, 2013
Sold by
Gentile John O and Gentile Ruth M
Bought by
2013 Gentile Ft
Current Estimated Value
Purchase Details
Closed on
Jan 8, 1999
Sold by
Donahue Thelma B
Bought by
Gentile John O and Gentile Ruth M
Purchase Details
Closed on
Oct 6, 1997
Sold by
Gallo Anne L
Bought by
Donahue Thelma B
Home Financials for this Owner
Home Financials are based on the most recent Mortgage that was taken out on this home.
Original Mortgage
$188,000
Interest Rate
7.41%
Mortgage Type
Purchase Money Mortgage
Create a Home Valuation Report for This Property
The Home Valuation Report is an in-depth analysis detailing your home's value as well as a comparison with similar homes in the area
Home Values in the Area
Average Home Value in this Area
Purchase History
| Date | Buyer | Sale Price | Title Company |
|---|---|---|---|
| 2013 Gentile Ft | -- | -- | |
| Gentile John O | $245,000 | -- | |
| Donahue Thelma B | $235,000 | -- |
Source: Public Records
Mortgage History
| Date | Status | Borrower | Loan Amount |
|---|---|---|---|
| Previous Owner | Donahue Thelma B | $20,000 | |
| Previous Owner | Donahue Thelma B | $188,000 |
Source: Public Records
Tax History
| Year | Tax Paid | Tax Assessment Tax Assessment Total Assessment is a certain percentage of the fair market value that is determined by local assessors to be the total taxable value of land and additions on the property. | Land | Improvement |
|---|---|---|---|---|
| 2025 | $9,601 | $909,200 | $571,200 | $338,000 |
| 2024 | $8,703 | $828,100 | $519,300 | $308,800 |
| 2023 | $8,799 | $778,700 | $492,600 | $286,100 |
| 2022 | $8,376 | $698,600 | $451,500 | $247,100 |
| 2021 | $8,505 | $640,900 | $400,200 | $240,700 |
| 2020 | $7,909 | $568,200 | $326,300 | $241,900 |
| 2019 | $7,648 | $549,800 | $307,900 | $241,900 |
| 2018 | $7,399 | $537,700 | $307,900 | $229,800 |
| 2017 | $7,410 | $537,700 | $307,900 | $229,800 |
| 2016 | $7,423 | $511,900 | $293,500 | $218,400 |
| 2015 | $6,889 | $475,400 | $266,800 | $208,600 |
Source: Public Records
Map
Nearby Homes
- 715 Summer St
- 33 Rockwood Rd
- 11 Elizabeth Way
- 35 Lincoln Ave
- 143 Winona St
- 410 Salem St Unit 1203
- 11 Hutchins Cir
- 6 Ashley Ct
- 741 Salem St
- 114 Lake St
- 20 Pine Hill Rd
- 344 Broadway
- 903 Foxwood Cir Unit 903
- 7 Pinewood Rd
- 103 Foxwood Cir
- 4 Lowell St
- 159 Main St
- 12 Heritage Ln
- 395 Vernon St
- 19 Lindauer St
Your Personal Tour Guide
Ask me questions while you tour the home.