Estimated Value: $468,000 - $604,000
3
Beds
3
Baths
1,702
Sq Ft
$324/Sq Ft
Est. Value
About This Home
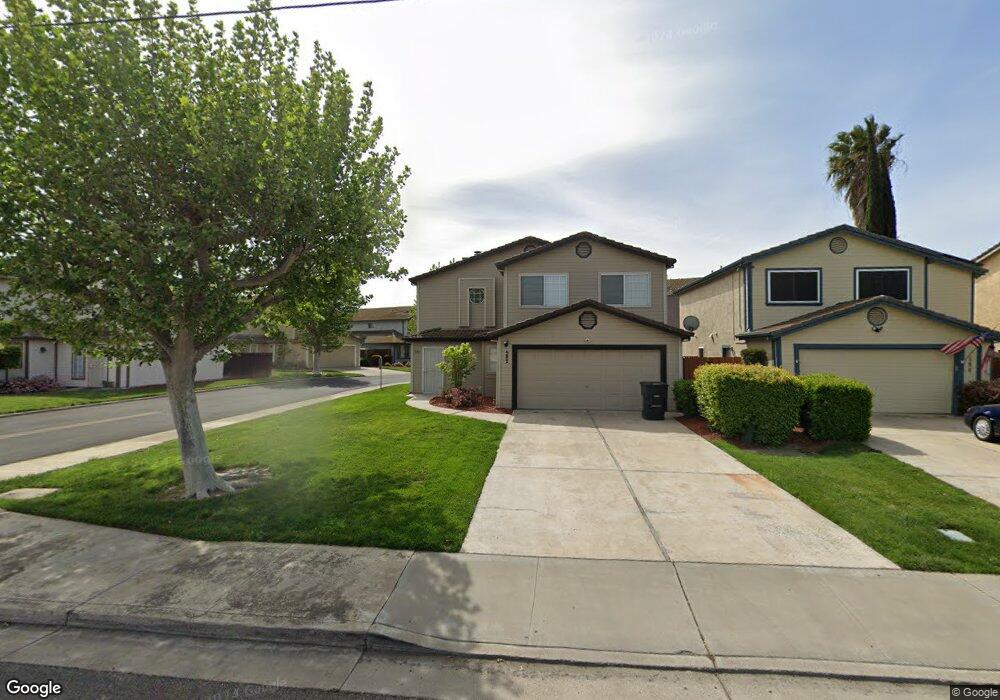
This home is located at 560 W 4th St, Tracy, CA 95376 and is currently estimated at $551,489, approximately $324 per square foot. 560 W 4th St is a home located in San Joaquin County with nearby schools including South/West Park Elementary School, Earle E. Williams Middle School, and Tracy High School.
Ownership History
Date
Name
Owned For
Owner Type
Purchase Details
Closed on
Sep 19, 2017
Sold by
Garcia Rodolfo Mendez
Bought by
Holt Smith Daniel J
Current Estimated Value
Home Financials for this Owner
Home Financials are based on the most recent Mortgage that was taken out on this home.
Original Mortgage
$390,000
Outstanding Balance
$325,678
Interest Rate
3.9%
Mortgage Type
VA
Estimated Equity
$225,811
Purchase Details
Closed on
Apr 4, 2017
Sold by
Garcia Rodolfo Mendez and Mendez Rodolfo
Bought by
Garcia Rodolfo Mendez
Home Financials for this Owner
Home Financials are based on the most recent Mortgage that was taken out on this home.
Original Mortgage
$292,500
Interest Rate
4.16%
Mortgage Type
New Conventional
Purchase Details
Closed on
Jun 30, 2004
Sold by
Mendez Rodolfo
Bought by
Mendez Rodolfo
Purchase Details
Closed on
Sep 13, 2000
Sold by
Mendez Maria F
Bought by
Mendez Rodolfo
Create a Home Valuation Report for This Property
The Home Valuation Report is an in-depth analysis detailing your home's value as well as a comparison with similar homes in the area
Home Values in the Area
Average Home Value in this Area
Purchase History
| Date | Buyer | Sale Price | Title Company |
|---|---|---|---|
| Holt Smith Daniel J | $390,000 | North American Title Co Inc | |
| Garcia Rodolfo Mendez | -- | First American Title Company | |
| Mendez Rodolfo | -- | Chicago Title Co | |
| Mendez Rodolfo | -- | -- |
Source: Public Records
Mortgage History
| Date | Status | Borrower | Loan Amount |
|---|---|---|---|
| Open | Holt Smith Daniel J | $390,000 | |
| Previous Owner | Garcia Rodolfo Mendez | $292,500 |
Source: Public Records
Tax History
| Year | Tax Paid | Tax Assessment Tax Assessment Total Assessment is a certain percentage of the fair market value that is determined by local assessors to be the total taxable value of land and additions on the property. | Land | Improvement |
|---|---|---|---|---|
| 2025 | $5,113 | $443,748 | $133,123 | $310,625 |
| 2024 | $4,712 | $435,048 | $130,513 | $304,535 |
| 2023 | $2,893 | $426,518 | $127,954 | $298,564 |
| 2022 | $2,921 | $418,156 | $125,446 | $292,710 |
| 2021 | $2,881 | $409,958 | $122,987 | $286,971 |
| 2020 | $2,893 | $405,755 | $121,726 | $284,029 |
| 2019 | $2,859 | $397,800 | $119,340 | $278,460 |
| 2018 | $4,319 | $390,000 | $117,000 | $273,000 |
| 2017 | $2,879 | $267,819 | $126,778 | $141,041 |
| 2016 | $2,837 | $262,569 | $124,293 | $138,276 |
| 2015 | $2,810 | $258,625 | $122,426 | $136,199 |
| 2014 | $2,647 | $253,561 | $120,029 | $133,532 |
Source: Public Records
Map
Nearby Homes
- 448 Burlington Dr
- 389 Burlington Dr
- 60 W South St
- 145 Machado Ct
- 920 Taft Ave
- 50 S Hickory Ave
- 18 W 8th St
- 740 Sequoia Blvd
- 829 Palm Cir
- 1660 Tahoe Cir
- 243 E 3rd St
- 864 Bogetti Ln
- 1555 Tahoe Cir
- 320 Accipiter Ct
- 206 W 12th St
- 319 W 12th St
- 166 Norman Ct
- 1601 Spring Ct
- 2055 Tahoe Cir
- 1110 Amaretto Dr
Your Personal Tour Guide
Ask me questions while you tour the home.