Estimated Value: $436,000 - $478,000
3
Beds
1
Bath
914
Sq Ft
$498/Sq Ft
Est. Value
About This Home
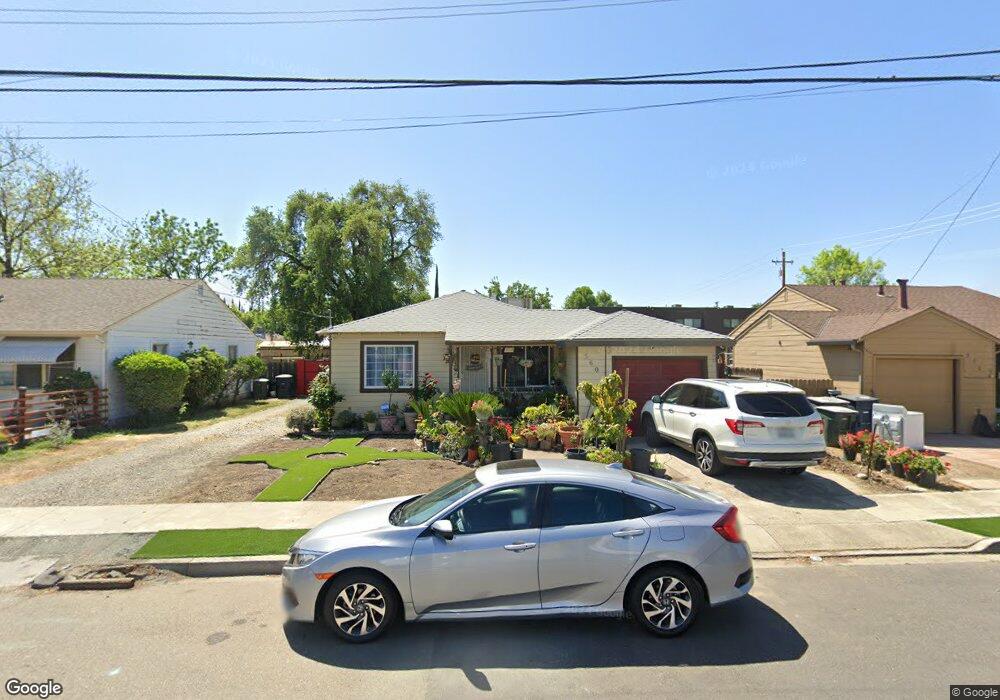
This home is located at 560 W Whittier Ave, Tracy, CA 95376 and is currently estimated at $454,862, approximately $497 per square foot. 560 W Whittier Ave is a home located in San Joaquin County with nearby schools including Central Elementary School, Merrill F. West High School, and Primary Charter School.
Ownership History
Date
Name
Owned For
Owner Type
Purchase Details
Closed on
Dec 3, 2003
Sold by
Rodriguez Aurora
Bought by
Valencia Jaime C
Current Estimated Value
Home Financials for this Owner
Home Financials are based on the most recent Mortgage that was taken out on this home.
Original Mortgage
$216,000
Outstanding Balance
$113,773
Interest Rate
8%
Mortgage Type
Purchase Money Mortgage
Estimated Equity
$341,089
Purchase Details
Closed on
Nov 25, 2003
Sold by
Perry Barbara Rachel and Barbara Rachel Perry Revocable
Bought by
Valencia Jamie C
Home Financials for this Owner
Home Financials are based on the most recent Mortgage that was taken out on this home.
Original Mortgage
$216,000
Outstanding Balance
$113,773
Interest Rate
8%
Mortgage Type
Purchase Money Mortgage
Estimated Equity
$341,089
Purchase Details
Closed on
Oct 31, 1995
Sold by
Perry Barbara Rachel
Bought by
Perry Barbara Rachel
Purchase Details
Closed on
Jun 15, 1995
Sold by
Richards Charles Leroy
Bought by
Perry Barbara R
Create a Home Valuation Report for This Property
The Home Valuation Report is an in-depth analysis detailing your home's value as well as a comparison with similar homes in the area
Home Values in the Area
Average Home Value in this Area
Purchase History
| Date | Buyer | Sale Price | Title Company |
|---|---|---|---|
| Valencia Jaime C | -- | First Amer Title Co | |
| Valencia Jamie C | $270,000 | First Amer Title Co | |
| Perry Barbara Rachel | -- | -- | |
| Perry Barbara R | -- | -- |
Source: Public Records
Mortgage History
| Date | Status | Borrower | Loan Amount |
|---|---|---|---|
| Open | Valencia Jamie C | $216,000 | |
| Closed | Valencia Jamie C | $54,000 |
Source: Public Records
Tax History Compared to Growth
Tax History
| Year | Tax Paid | Tax Assessment Tax Assessment Total Assessment is a certain percentage of the fair market value that is determined by local assessors to be the total taxable value of land and additions on the property. | Land | Improvement |
|---|---|---|---|---|
| 2025 | $4,348 | $383,861 | $115,156 | $268,705 |
| 2024 | $4,004 | $376,336 | $112,899 | $263,437 |
| 2023 | $3,941 | $368,958 | $110,686 | $258,272 |
| 2022 | $3,860 | $361,724 | $108,516 | $253,208 |
| 2021 | $3,813 | $354,633 | $106,389 | $248,244 |
| 2020 | $3,788 | $350,998 | $105,299 | $245,699 |
| 2019 | $3,727 | $344,117 | $103,235 | $240,882 |
| 2018 | $3,663 | $337,370 | $101,211 | $236,159 |
| 2017 | $3,478 | $330,756 | $99,227 | $231,529 |
| 2016 | $3,318 | $306,000 | $92,000 | $214,000 |
| 2014 | $1,434 | $139,700 | $41,800 | $97,900 |
Source: Public Records
Map
Nearby Homes
- 535 W Carlton Way
- 1930 Wall St
- 1561 Bessie Ave
- 2192 Wildflower Ct
- 1792 Chester Dr
- 262 W Lowell Ave
- 2214 Morningside Ct
- 546 W Grant Line Rd
- 242 W Lowell Ave
- 228 W Lowell Ave
- 1865 Newport Ct
- 110 W 23rd St
- 2840-2896 Holly Dr
- 16 Pereira Ave
- 971 Plantation Ct
- 34 Pereira Ave
- 1228 Bessie Ave
- 1300 Richard Dr
- 1427 Audrey Dr
- 130 E 21st St
- 550 W Whittier Ave
- 540 W Whittier Ave
- 1812 N Tracy Blvd
- 559 W Emerson Ave
- 553 W Emerson Ave
- 534 W Whittier Ave
- 553 W Whittier Ave
- 543 W Emerson Ave
- 575 W Emerson Ave
- 565 W Whittier Ave
- 555 W Whittier Ave
- 520 W Whittier Ave
- 545 W Whittier Ave
- 537 W Emerson Ave
- 533 W Whittier Ave
- 529 W Emerson Ave
- 516 W Whittier Ave
- 1800 N Tracy Blvd
- 525 W Whittier Ave
- 525 W Emerson Ave