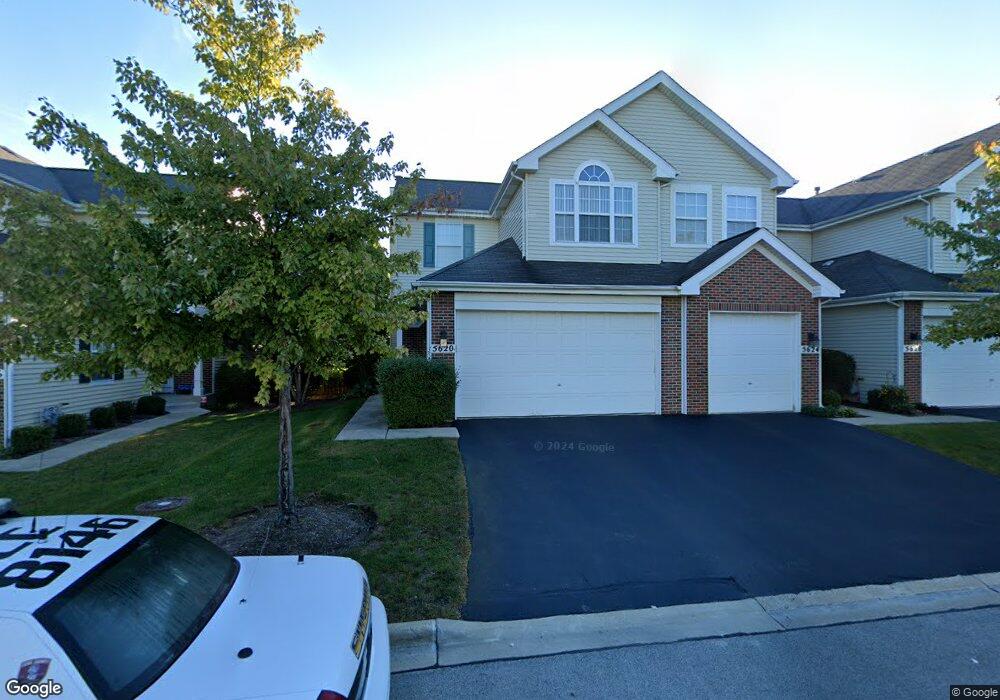
5600 Astor Ln Unit 5600223 Rolling Meadows, IL 60008
Busse Woods NeighborhoodEstimated Value: $165,284 - $183,000
2
Beds
--
Bath
--
Sq Ft
11.95
Acres
About This Home
This home is located at 5600 Astor Ln Unit 5600223, Rolling Meadows, IL 60008 and is currently estimated at $174,321. 5600 Astor Ln Unit 5600223 is a home located in Cook County with nearby schools including Willow Bend Elementary School, Carl Sandburg Junior High School, and Rolling Meadows High School.
Ownership History
Date
Name
Owned For
Owner Type
Purchase Details
Closed on
Jun 19, 2020
Sold by
Niedzielski Monika M
Bought by
Rlt Monika M Niedzielski
Current Estimated Value
Purchase Details
Closed on
Oct 26, 2012
Sold by
Niedzielski Bartlomiej and Skrzydlewska Monika
Bought by
Niedzielski Monika
Purchase Details
Closed on
Aug 15, 2005
Sold by
Englese Anthony R and Perezic Senada
Bought by
Niedzielski Bartlomiej and Skrzydlewska Monika
Home Financials for this Owner
Home Financials are based on the most recent Mortgage that was taken out on this home.
Original Mortgage
$112,000
Outstanding Balance
$63,332
Interest Rate
6.87%
Mortgage Type
Purchase Money Mortgage
Estimated Equity
$110,989
Purchase Details
Closed on
Apr 19, 2005
Sold by
Equities Venture Corp
Bought by
Englese Anthony R and Perezic Senada
Home Financials for this Owner
Home Financials are based on the most recent Mortgage that was taken out on this home.
Original Mortgage
$89,900
Interest Rate
6.05%
Mortgage Type
Fannie Mae Freddie Mac
Create a Home Valuation Report for This Property
The Home Valuation Report is an in-depth analysis detailing your home's value as well as a comparison with similar homes in the area
Home Values in the Area
Average Home Value in this Area
Purchase History
| Date | Buyer | Sale Price | Title Company |
|---|---|---|---|
| Rlt Monika M Niedzielski | -- | First American Title Ins Co | |
| Niedzielski Monika | -- | None Available | |
| Niedzielski Bartlomiej | $140,000 | First American Title | |
| Englese Anthony R | $100,000 | Lawyers |
Source: Public Records
Mortgage History
| Date | Status | Borrower | Loan Amount |
|---|---|---|---|
| Open | Niedzielski Bartlomiej | $112,000 | |
| Previous Owner | Englese Anthony R | $89,900 |
Source: Public Records
Tax History Compared to Growth
Tax History
| Year | Tax Paid | Tax Assessment Tax Assessment Total Assessment is a certain percentage of the fair market value that is determined by local assessors to be the total taxable value of land and additions on the property. | Land | Improvement |
|---|---|---|---|---|
| 2024 | $3,202 | $10,485 | $1,229 | $9,256 |
| 2023 | $3,063 | $10,485 | $1,229 | $9,256 |
| 2022 | $3,063 | $10,485 | $1,229 | $9,256 |
| 2021 | $2,660 | $8,075 | $806 | $7,269 |
| 2020 | $2,597 | $8,075 | $806 | $7,269 |
| 2019 | $2,619 | $9,051 | $806 | $8,245 |
| 2018 | $1,933 | $5,995 | $691 | $5,304 |
| 2017 | $1,894 | $5,995 | $691 | $5,304 |
| 2016 | $1,764 | $5,995 | $691 | $5,304 |
| 2015 | $1,543 | $4,926 | $614 | $4,312 |
| 2014 | $1,574 | $5,145 | $614 | $4,531 |
| 2013 | $1,871 | $6,267 | $614 | $5,653 |
Source: Public Records
Map
Nearby Homes
- 5600 Astor Ln Unit 103
- 5406 Chateau Unit 4
- 5451 Elizabeth Place Unit 906
- 1860 W Surrey Park Ln Unit 1C
- 1510 W Russell Ct
- 1322 S New Wilke Rd Unit 1C
- 5500 Carriageway Dr Unit 213
- 1306 S New Wilke Rd Unit 2B
- 5300 Carriageway Dr Unit 302
- 5400 Carriageway Dr Unit 109
- 1227 S Old Wilke Rd Unit 12209
- 1227 S Old Wilke Rd Unit 306
- 2402 Algonquin Rd Unit 9
- 1217 S Old Wilke Rd Unit 11406
- 2502 Algonquin Rd Unit 2
- 2312 Algonquin Rd Unit 3
- 2504 Algonquin Rd Unit 14
- 1206 S New Wilke Rd Unit 108
- 1207 S Old Wilke Rd Unit 303
- 2506 Algonquin Rd Unit 1
- 5600 Astor Ln Unit 318
- 5600 Astor Ln Unit 311
- 5600 Astor Ln Unit 208
- 5600 Astor Ln Unit 113
- 5600 Astor Ln Unit 123
- 5600 Astor Ln Unit 213
- 5600 Astor Ln Unit 211
- 5600 Astor Ln Unit 5600322
- 5600 Astor Ln Unit 5600320
- 5600 Astor Ln Unit 5600318
- 5600 Astor Ln Unit 5600317
- 5600 Astor Ln Unit 5600314
- 5600 Astor Ln Unit 5600310
- 5600 Astor Ln Unit 5600309
- 5600 Astor Ln Unit 5600214
- 5600 Astor Ln Unit 5600213
- 5600 Astor Ln Unit 5600210
- 5600 Astor Ln Unit 5600203
- 5600 Astor Ln Unit 5600121
- 5600 Astor Ln Unit 5600117