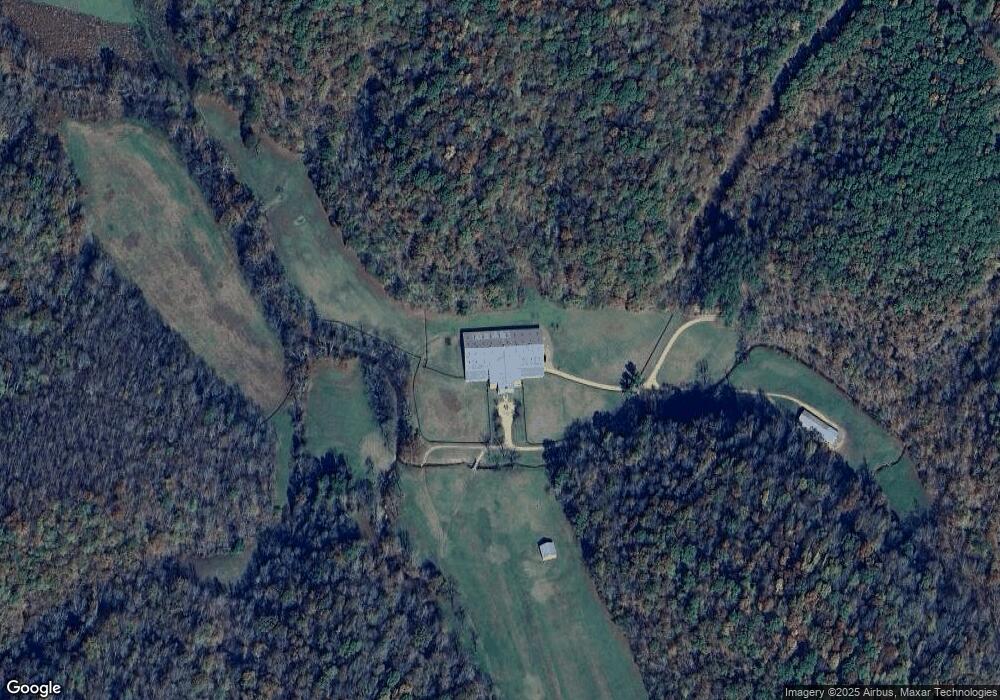
5600 Boy Scout Rd Franklin, TN 37064
Estimated Value: $2,336,000 - $5,184,590
--
Bed
4
Baths
4,564
Sq Ft
$754/Sq Ft
Est. Value
About This Home
This home is located at 5600 Boy Scout Rd, Franklin, TN 37064 and is currently estimated at $3,442,197, approximately $754 per square foot. 5600 Boy Scout Rd is a home located in Williamson County with nearby schools including Hillsboro Elementary/Middle School.
Ownership History
Date
Name
Owned For
Owner Type
Purchase Details
Closed on
Aug 14, 2024
Sold by
Crews Charles E
Bought by
Crews Kimberly
Current Estimated Value
Purchase Details
Closed on
Jun 17, 2022
Sold by
Crews Charles E and Crews Kimberly
Bought by
Schmucker Brian
Purchase Details
Closed on
Sep 3, 2021
Sold by
Crews Charles E and C E Crews Jr Cc Trust
Bought by
Osman Nancy
Purchase Details
Closed on
Jan 17, 2020
Sold by
Th Farm Llc
Bought by
Schmucker Brian and Schmucker Julie
Purchase Details
Closed on
Jun 23, 2017
Sold by
Crews Charles E and Crews Kimberly
Bought by
Th Farm Llc
Purchase Details
Closed on
Jun 6, 2000
Sold by
Preston Aubrey B and Preston Penny J
Bought by
Crews Charles E and Crews Kimberly
Home Financials for this Owner
Home Financials are based on the most recent Mortgage that was taken out on this home.
Original Mortgage
$2,996,950
Interest Rate
8.14%
Mortgage Type
Seller Take Back
Create a Home Valuation Report for This Property
The Home Valuation Report is an in-depth analysis detailing your home's value as well as a comparison with similar homes in the area
Home Values in the Area
Average Home Value in this Area
Purchase History
| Date | Buyer | Sale Price | Title Company |
|---|---|---|---|
| Crews Kimberly | -- | None Listed On Document | |
| Schmucker Brian | $1,273,800 | None Listed On Document | |
| Osman Nancy | $490,169 | Dickson Title | |
| Schmucker Brian | $4,500,000 | None Available | |
| Th Farm Llc | $412,500 | None Available | |
| Crews Charles E | $2,996,950 | -- |
Source: Public Records
Mortgage History
| Date | Status | Borrower | Loan Amount |
|---|---|---|---|
| Previous Owner | Crews Charles E | $2,996,950 |
Source: Public Records
Tax History Compared to Growth
Tax History
| Year | Tax Paid | Tax Assessment Tax Assessment Total Assessment is a certain percentage of the fair market value that is determined by local assessors to be the total taxable value of land and additions on the property. | Land | Improvement |
|---|---|---|---|---|
| 2025 | $7,896 | $502,950 | $126,625 | $376,325 |
| 2024 | $7,896 | $420,000 | $99,450 | $320,550 |
| 2023 | $7,896 | $420,000 | $99,450 | $320,550 |
| 2022 | $7,995 | $425,250 | $104,700 | $320,550 |
| 2021 | $7,995 | $425,250 | $104,700 | $320,550 |
| 2020 | $8,689 | $391,400 | $79,275 | $312,125 |
| 2019 | $8,689 | $391,400 | $79,275 | $312,125 |
| 2018 | $8,415 | $391,400 | $79,275 | $312,125 |
| 2017 | $8,446 | $392,825 | $80,700 | $312,125 |
| 2016 | $8,446 | $392,825 | $80,700 | $312,125 |
| 2015 | -- | $329,025 | $62,000 | $267,025 |
| 2014 | -- | $329,025 | $62,000 | $267,025 |
Source: Public Records
Map
Nearby Homes
- 5556 Boy Scout Rd
- 5723 Quest Ridge Rd
- 5717 Quest Ridge Rd
- 0 Alex Ct
- 0 Songbird Springs Ln
- 7501 Ivorybill Ln
- 5610 Hargrove Rd
- 7111 Lyric Private Ln
- 5616 Pinewood Rd
- 5009 Lone Oak Private Trail
- 5532 Pinewood Rd
- 5623 Pinewood Rd
- 5580 Powell Sullivan Rd
- 5656 Walter King Rd
- 5569 Parker Branch Rd
- 7556 Caney Fork Rd
- 7393 S Harpeth Rd
- 5450 Old Highway 96
- 0 Pinewood Rd Unit 23137598
- 0 Pinewood Rd Unit RTC2813203