Estimated Value: $201,888 - $220,000
3
Beds
1
Bath
1,072
Sq Ft
$199/Sq Ft
Est. Value
About This Home
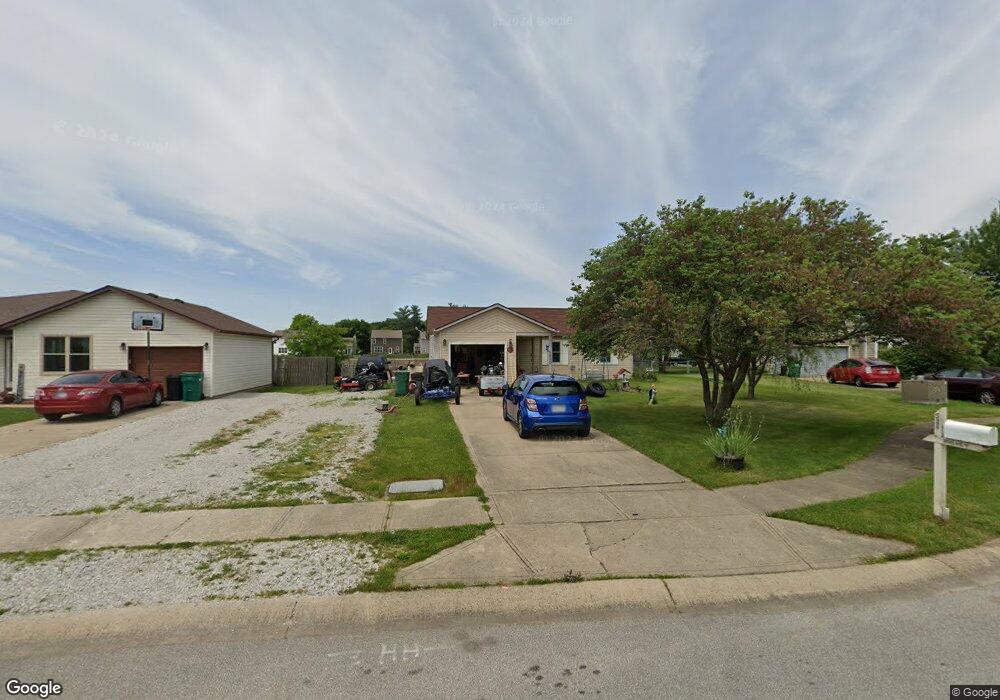
This home is located at 5600 E Marjorie Ct, Camby, IN 46113 and is currently estimated at $213,222, approximately $198 per square foot. 5600 E Marjorie Ct is a home located in Morgan County with nearby schools including Mooresville High School and Mooresville Christian Academy.
Ownership History
Date
Name
Owned For
Owner Type
Purchase Details
Closed on
May 1, 2019
Sold by
Hughey Michael L
Bought by
Hughey Michael L and Hughey Virginia
Current Estimated Value
Home Financials for this Owner
Home Financials are based on the most recent Mortgage that was taken out on this home.
Original Mortgage
$113,630
Outstanding Balance
$99,285
Interest Rate
4%
Mortgage Type
VA
Estimated Equity
$113,937
Purchase Details
Closed on
Nov 11, 2010
Sold by
Smith Roy
Bought by
Hughey Michael L
Home Financials for this Owner
Home Financials are based on the most recent Mortgage that was taken out on this home.
Original Mortgage
$86,830
Interest Rate
4.62%
Mortgage Type
FHA
Purchase Details
Closed on
May 27, 2008
Sold by
Chicago Title Insurance Co
Bought by
Smith Roy
Purchase Details
Closed on
May 5, 2008
Sold by
United Tax Group Llc
Bought by
Chicago Title Insurance Company
Purchase Details
Closed on
Nov 14, 2005
Sold by
Boutwell Delbert E
Bought by
Beneficial Indiana Inc and Beneficial Mortgage Co
Create a Home Valuation Report for This Property
The Home Valuation Report is an in-depth analysis detailing your home's value as well as a comparison with similar homes in the area
Home Values in the Area
Average Home Value in this Area
Purchase History
| Date | Buyer | Sale Price | Title Company |
|---|---|---|---|
| Hughey Michael L | -- | Vantage Point Title | |
| Hughey Michael L | -- | -- | |
| Smith Roy | -- | -- | |
| Chicago Title Insurance Company | -- | -- | |
| Beneficial Indiana Inc | -- | None Available |
Source: Public Records
Mortgage History
| Date | Status | Borrower | Loan Amount |
|---|---|---|---|
| Open | Hughey Michael L | $113,630 | |
| Closed | Hughey Michael L | $86,830 |
Source: Public Records
Tax History Compared to Growth
Tax History
| Year | Tax Paid | Tax Assessment Tax Assessment Total Assessment is a certain percentage of the fair market value that is determined by local assessors to be the total taxable value of land and additions on the property. | Land | Improvement |
|---|---|---|---|---|
| 2024 | $154 | $176,900 | $48,700 | $128,200 |
| 2023 | $151 | $176,400 | $48,700 | $127,700 |
| 2022 | $148 | $149,200 | $48,700 | $100,500 |
| 2021 | $145 | $117,600 | $21,600 | $96,000 |
| 2020 | $142 | $113,900 | $21,600 | $92,300 |
| 2019 | $139 | $112,600 | $21,600 | $91,000 |
| 2018 | $145 | $103,600 | $21,600 | $82,000 |
| 2017 | $142 | $95,900 | $21,600 | $74,300 |
| 2016 | $140 | $92,500 | $21,600 | $70,900 |
| 2014 | $174 | $80,200 | $16,600 | $63,600 |
| 2013 | $174 | $81,000 | $16,600 | $64,400 |
Source: Public Records
Map
Nearby Homes
- 5645 E Donald Ct
- 5650 Donald Ct E
- 5414 Collett Dr E
- 12756 N Commons East Dr
- 12754 N Commons East Dr
- 5406 E Commons North Dr
- 8707 Hollander Dr
- 13026 N Becks Grove Dr
- 13116 N Becks Grove Dr
- 6225 E Mariah Hill Ln
- 0 N Oak Dr Unit MBR22050808
- 6211 E Ayrshire Cir
- 349 N Post Oak Dr
- 380 N Post Oak Dr
- 6030 E Terhune Ct
- 13847 N Settle Way
- 6361 E Walton Dr N
- 6081 E Terhune Ct
- 6150 E Terhune Ct
- 241 Liberty Blvd
- 5590 E Marjorie Ct
- 5604 E Marjorie Ct
- 12894 N Charles Ct
- 5580 E Marjorie Ct
- 5610 E Marjorie Ct
- 5615 E Marjorie Ct
- 12904 N Charles Ct
- 5620 E Marjorie Ct
- 5570 E Marjorie Ct
- 5630 E Marjorie Ct
- 5575 E Marjorie Ct
- 12914 N Charles Ct
- 5635 E Marjorie Ct
- 12937 N Charles Ct
- 12924 N Charles Ct
- 12924 N Charles Ct
- 5564 E Marjorie Ct
- 5640 E Marjorie Ct
- 12944 N Charles Ct
- 5585 Donald Ct E