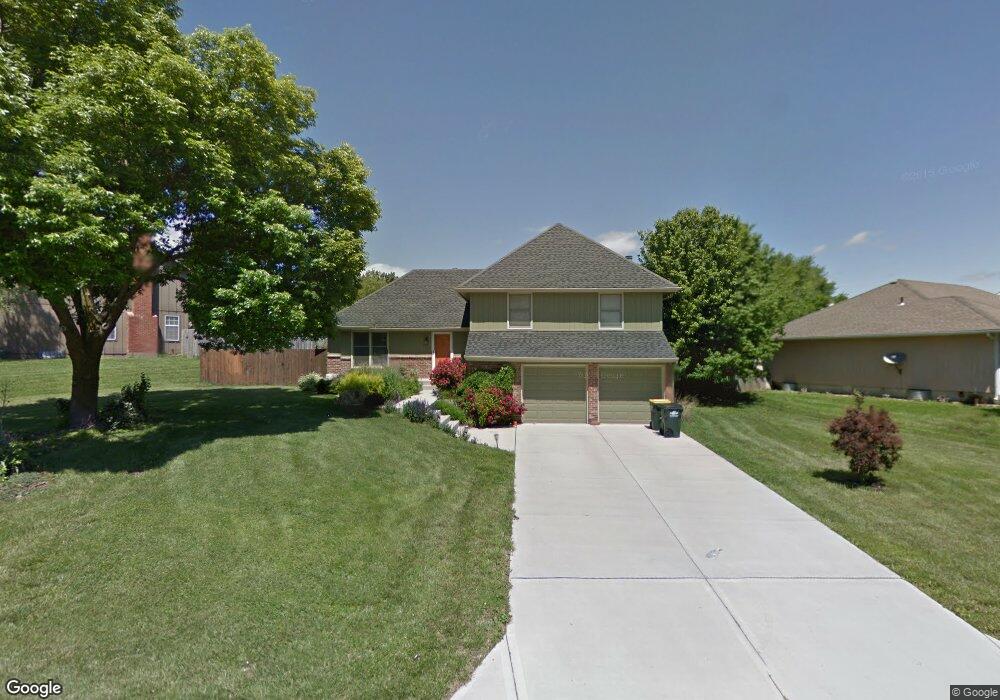
5600 Gleason Rd Shawnee, KS 66226
Estimated Value: $357,289 - $371,000
3
Beds
3
Baths
1,316
Sq Ft
$277/Sq Ft
Est. Value
About This Home
This home is located at 5600 Gleason Rd, Shawnee, KS 66226 and is currently estimated at $365,072, approximately $277 per square foot. 5600 Gleason Rd is a home located in Johnson County with nearby schools including Belmont Elementary School, Mill Creek Middle School, and De Soto High School.
Ownership History
Date
Name
Owned For
Owner Type
Purchase Details
Closed on
May 18, 2016
Sold by
Vanvanleeuwen Kale Van
Bought by
Vanvanleeuwen Crystal Van
Current Estimated Value
Purchase Details
Closed on
Oct 24, 2005
Sold by
Pareja Walter Antonio and Youssefi Rita
Bought by
Vanvanleeuwen Kale Van and Leeuwen Crystal Van
Home Financials for this Owner
Home Financials are based on the most recent Mortgage that was taken out on this home.
Original Mortgage
$161,505
Interest Rate
5.73%
Mortgage Type
New Conventional
Purchase Details
Closed on
Aug 19, 2003
Sold by
Graniewski Gary R and Graniewski Jeri K
Bought by
Pareja Walter Antonio and Youssefi Rita
Home Financials for this Owner
Home Financials are based on the most recent Mortgage that was taken out on this home.
Original Mortgage
$153,734
Interest Rate
5.51%
Mortgage Type
Purchase Money Mortgage
Create a Home Valuation Report for This Property
The Home Valuation Report is an in-depth analysis detailing your home's value as well as a comparison with similar homes in the area
Home Values in the Area
Average Home Value in this Area
Purchase History
| Date | Buyer | Sale Price | Title Company |
|---|---|---|---|
| Vanvanleeuwen Crystal Van | -- | None Available | |
| Vanvanleeuwen Kale Van | -- | Chicago Title Ins Co | |
| Pareja Walter Antonio | -- | Guarantee Title |
Source: Public Records
Mortgage History
| Date | Status | Borrower | Loan Amount |
|---|---|---|---|
| Previous Owner | Vanvanleeuwen Kale Van | $161,505 | |
| Previous Owner | Pareja Walter Antonio | $153,734 |
Source: Public Records
Tax History Compared to Growth
Tax History
| Year | Tax Paid | Tax Assessment Tax Assessment Total Assessment is a certain percentage of the fair market value that is determined by local assessors to be the total taxable value of land and additions on the property. | Land | Improvement |
|---|---|---|---|---|
| 2024 | $4,116 | $35,627 | $7,054 | $28,573 |
| 2023 | $4,018 | $34,224 | $7,054 | $27,170 |
| 2022 | $3,920 | $32,706 | $6,126 | $26,580 |
| 2021 | $3,489 | $27,888 | $5,833 | $22,055 |
| 2020 | $3,140 | $24,852 | $5,833 | $19,019 |
| 2019 | $3,108 | $24,242 | $5,076 | $19,166 |
| 2018 | $3,018 | $23,322 | $5,076 | $18,246 |
| 2017 | $2,964 | $22,344 | $4,457 | $17,887 |
| 2016 | $2,858 | $21,275 | $4,457 | $16,818 |
| 2015 | $2,773 | $20,378 | $4,457 | $15,921 |
| 2013 | -- | $18,860 | $4,457 | $14,403 |
Source: Public Records
Map
Nearby Homes
- 5858 Mccormick Dr
- 5625 Meadow View Dr
- The Paxton III Plan at Canyon Lakes
- The Sydney III Plan at Canyon Lakes
- The Harlow V Plan at Canyon Lakes
- The Hailey Plan at Canyon Lakes
- The Brooklyn II Plan at Canyon Lakes
- The Niko Plan at Canyon Lakes
- The Payton Plan at Canyon Lakes
- The Aspen Plan at Canyon Lakes
- The Levi II Plan at Canyon Lakes
- The Madison Plan at Canyon Lakes
- The Ellsworth Plan at Canyon Lakes
- The Dakota Plan at Canyon Lakes
- The Ashland Plan at Canyon Lakes
- The Davidson II Plan at Canyon Lakes
- 5764 Apache Dr
- 6122 Lewis Dr
- 6118 Lewis Dr
- 6114 Lewis Dr