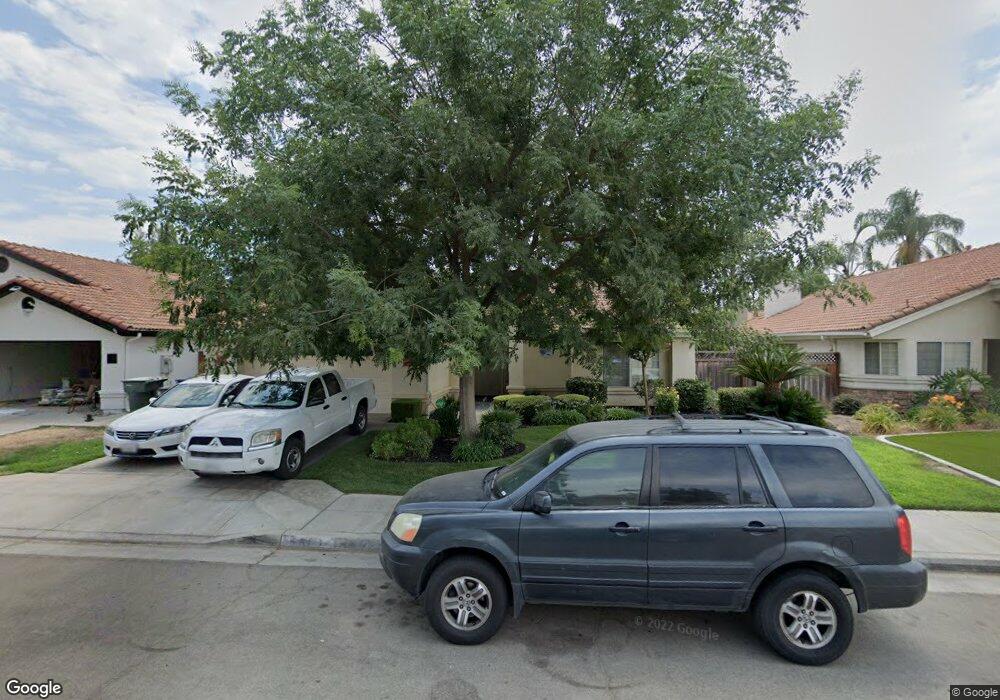
5601 W Los Altos Ave Fresno, CA 93722
Fig Garden Loop NeighborhoodEstimated Value: $398,402 - $436,000
3
Beds
2
Baths
1,590
Sq Ft
$260/Sq Ft
Est. Value
About This Home
This home is located at 5601 W Los Altos Ave, Fresno, CA 93722 and is currently estimated at $413,351, approximately $259 per square foot. 5601 W Los Altos Ave is a home located in Fresno County with nearby schools including River Bluff Elementary School and Rio Vista Middle School.
Ownership History
Date
Name
Owned For
Owner Type
Purchase Details
Closed on
Sep 22, 2023
Sold by
Andersen Terry P
Bought by
Terry Andersen Revocable Trust and Andersen
Current Estimated Value
Purchase Details
Closed on
Sep 18, 2023
Sold by
Andersen Terry P
Bought by
Terry Andersen Revocable Trust and Andersen
Purchase Details
Closed on
Apr 22, 2021
Sold by
Andersen Eric K and Andersen Terry P
Bought by
Andersen Terry P
Home Financials for this Owner
Home Financials are based on the most recent Mortgage that was taken out on this home.
Original Mortgage
$160,000
Interest Rate
3%
Mortgage Type
New Conventional
Purchase Details
Closed on
Mar 16, 2017
Sold by
Andersen Eric K
Bought by
Andersen Eric K and Andersen Terry P
Purchase Details
Closed on
Sep 30, 1994
Sold by
Andersen Maja B
Bought by
Maja B Andersen Revocable Living Trust
Create a Home Valuation Report for This Property
The Home Valuation Report is an in-depth analysis detailing your home's value as well as a comparison with similar homes in the area
Home Values in the Area
Average Home Value in this Area
Purchase History
| Date | Buyer | Sale Price | Title Company |
|---|---|---|---|
| Terry Andersen Revocable Trust | -- | None Listed On Document | |
| Terry Andersen Revocable Trust | -- | None Listed On Document | |
| Andersen Terry P | -- | Stewart Title Of Ca Inc | |
| Andersen Eric K | -- | None Available | |
| Maja B Andersen Revocable Living Trust | -- | -- |
Source: Public Records
Mortgage History
| Date | Status | Borrower | Loan Amount |
|---|---|---|---|
| Previous Owner | Andersen Terry P | $160,000 |
Source: Public Records
Tax History Compared to Growth
Tax History
| Year | Tax Paid | Tax Assessment Tax Assessment Total Assessment is a certain percentage of the fair market value that is determined by local assessors to be the total taxable value of land and additions on the property. | Land | Improvement |
|---|---|---|---|---|
| 2025 | $3,380 | $266,089 | $74,236 | $191,853 |
| 2023 | $3,300 | $255,758 | $71,354 | $184,404 |
| 2022 | $3,115 | $250,744 | $69,955 | $180,789 |
| 2021 | $2,534 | $197,658 | $57,168 | $140,490 |
| 2020 | $2,411 | $195,632 | $56,582 | $139,050 |
| 2019 | $2,375 | $191,797 | $55,473 | $136,324 |
| 2018 | $2,321 | $188,037 | $54,386 | $133,651 |
| 2017 | $2,243 | $184,351 | $53,320 | $131,031 |
| 2016 | $2,067 | $180,737 | $52,275 | $128,462 |
| 2015 | $2,057 | $178,023 | $51,490 | $126,533 |
| 2014 | $2,055 | $174,537 | $50,482 | $124,055 |
Source: Public Records
Map
Nearby Homes
- 6536 N Wheeler Ave
- 6675 N Lola Ave
- 6583 N State Ave
- 5807 W Paul Ave
- 5802 W Millbrae Ave
- 5908 W Fremont Ave
- 6324 N Wheeler Ave
- 6294 W Northdale Ave
- 5753 W Ellery Ave
- 6671 N Sandrini Ave
- 5989 W Turtle Bay Dr
- 5838 W Fallon Ave
- 7195 N Carnegie Ave
- 6075 W Menlo Ave
- 5628 W Mesa Ave
- 6542 N Brix Ave
- 6220 N Ellendale Ave
- 5049 W Locust Ave
- 5804 W Chennault Ave
- 6508 N Lodi Ave
- 5589 W Los Altos Ave
- 5609 W Los Altos Ave
- 5592 W Wathen Ave
- 5604 W Wathen Ave
- 5582 W Wathen Ave
- 5579 W Los Altos Ave
- 5617 W Los Altos Ave
- 5604 W Los Altos Ave
- 5592 W Los Altos Ave
- 5616 W Wathen Ave
- 5572 W Wathen Ave
- 5612 W Los Altos Ave
- 5582 W Los Altos Ave
- 5567 W Los Altos Ave
- 5625 W Los Altos Ave
- 5628 W Wathen Ave
- 5562 W Wathen Ave
- 5630 W Los Altos Ave
- 5570 W Los Altos Ave
- 5591 W Wathen Ave