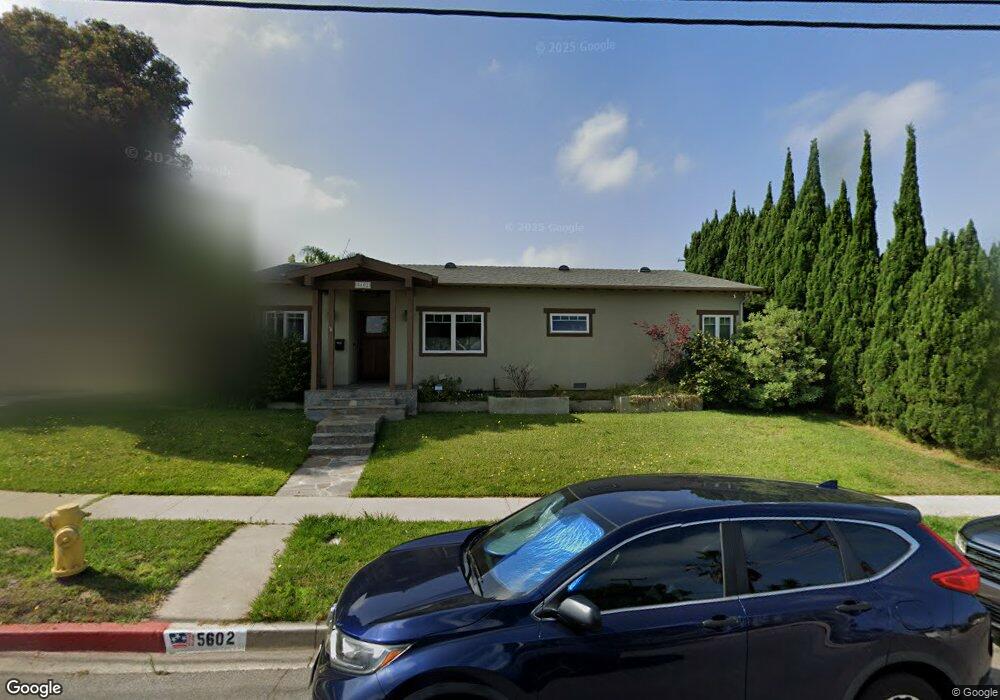
5602 Ruby St Torrance, CA 90503
Southwood NeighborhoodEstimated Value: $1,413,000 - $1,520,000
3
Beds
2
Baths
1,516
Sq Ft
$963/Sq Ft
Est. Value
About This Home
This home is located at 5602 Ruby St, Torrance, CA 90503 and is currently estimated at $1,459,476, approximately $962 per square foot. 5602 Ruby St is a home located in Los Angeles County with nearby schools including Anza Elementary School, Jefferson Middle School, and West High School.
Ownership History
Date
Name
Owned For
Owner Type
Purchase Details
Closed on
Mar 29, 2022
Sold by
Hoemberg David J and Hoemberg Paula J
Bought by
Hoemberg David J and Hoemberg Paula J
Current Estimated Value
Home Financials for this Owner
Home Financials are based on the most recent Mortgage that was taken out on this home.
Original Mortgage
$624,500
Outstanding Balance
$581,952
Interest Rate
3.69%
Mortgage Type
New Conventional
Estimated Equity
$877,524
Purchase Details
Closed on
Feb 7, 2021
Sold by
Hoemberg David J and Hoemberg Paula J
Bought by
Hoemberg Paula J and Hoemberg Dylan
Purchase Details
Closed on
Nov 8, 1993
Sold by
Woodworth Bradley M and Woodworth Yvette M
Bought by
Hoemberg David J and Hoemberg Paula J
Home Financials for this Owner
Home Financials are based on the most recent Mortgage that was taken out on this home.
Original Mortgage
$200,000
Interest Rate
6.74%
Create a Home Valuation Report for This Property
The Home Valuation Report is an in-depth analysis detailing your home's value as well as a comparison with similar homes in the area
Home Values in the Area
Average Home Value in this Area
Purchase History
| Date | Buyer | Sale Price | Title Company |
|---|---|---|---|
| Hoemberg David J | -- | Servicelink | |
| Hoemberg Paula J | -- | None Listed On Document | |
| Hoemberg David J | $250,000 | Commonwealth Land Title Co |
Source: Public Records
Mortgage History
| Date | Status | Borrower | Loan Amount |
|---|---|---|---|
| Open | Hoemberg David J | $624,500 | |
| Previous Owner | Hoemberg David J | $200,000 |
Source: Public Records
Tax History
| Year | Tax Paid | Tax Assessment Tax Assessment Total Assessment is a certain percentage of the fair market value that is determined by local assessors to be the total taxable value of land and additions on the property. | Land | Improvement |
|---|---|---|---|---|
| 2025 | $6,833 | $594,829 | $339,924 | $254,905 |
| 2024 | $6,833 | $583,166 | $333,259 | $249,907 |
| 2023 | $6,989 | $571,732 | $326,725 | $245,007 |
| 2022 | $12,183 | $1,007,033 | $753,646 | $253,387 |
| 2021 | $6,495 | $549,532 | $314,039 | $235,493 |
| 2019 | $6,307 | $533,234 | $304,725 | $228,509 |
| 2018 | $6,080 | $522,779 | $298,750 | $224,029 |
| 2016 | $5,576 | $483,193 | $287,150 | $196,043 |
| 2015 | $5,454 | $475,936 | $282,837 | $193,099 |
| 2014 | $5,315 | $466,614 | $277,297 | $189,317 |
Source: Public Records
Map
Nearby Homes
- 601 S Prospect Ave Unit 103
- 603 S Prospect Ave Unit 205
- 1200 Opal St Unit 7
- 1100 Barbara St
- 1110 Barbara St
- 21913 Palos Verdes Blvd
- 5033 Carmen St
- 802 Camino Real Unit 206
- 5500 Torrance Blvd Unit A211
- 21625 Bernice Ave
- 1108 Camino Real Unit 407
- 1108 Camino Real Unit 306
- 1108 Camino Real Unit 409
- 21110 Wood Ave
- 904 Knob Hill Ave
- 625 Camino Real
- 4926 Jacques St
- 5316 Emerald St
- 222 S Juanita Ave Unit A
- 426 Camino Real
- 5606 Ruby St
- 21509 Scannel Ave
- 5610 Ruby St
- 21506 Scannel Ave
- 21502 Scannel Ave
- 21513 Scannel Ave
- 21510 Scannel Ave
- 5607 Ruby St
- 5614 Ruby St
- 21514 Scannel Ave
- 5613 Ruby Place
- 21517 Scannel Ave
- 21418 Mildred Ave
- 21518 Scannel Ave
- 5617 Ruby Place
- 21601 Scannel Ave
- 21505 Redbeam Ave
- 21501 Redbeam Ave
- 21414 Mildred Ave
- 5610 Ruby Place
Your Personal Tour Guide
Ask me questions while you tour the home.